+ WHAT?
CDA Sonic Drift maps sonic shifts in Brussels Territory North, supporting inclusive, listening-based approaches to spatial planning and design.
+ HOW?
AI-powered sonic dérive using geocoded walks, rooftop logging, and AI analysis, resulting in an audio essay, dubplate installation, and feedback tool.
Base Milano 2025 – Rafael Jacinto
Base Milano 2025 – Rafael Jacinto
Base Milano 2025 – Rafael Jacinto
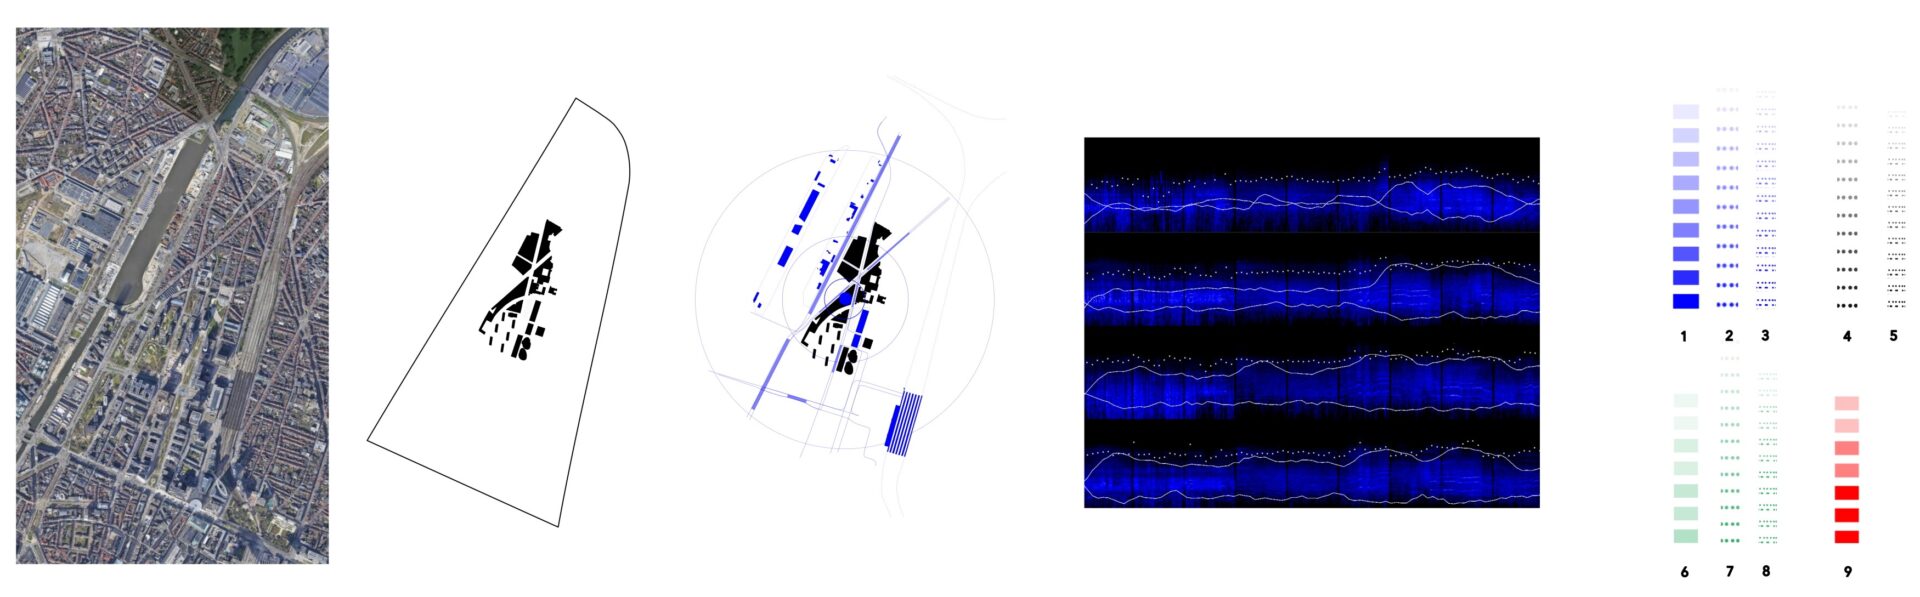


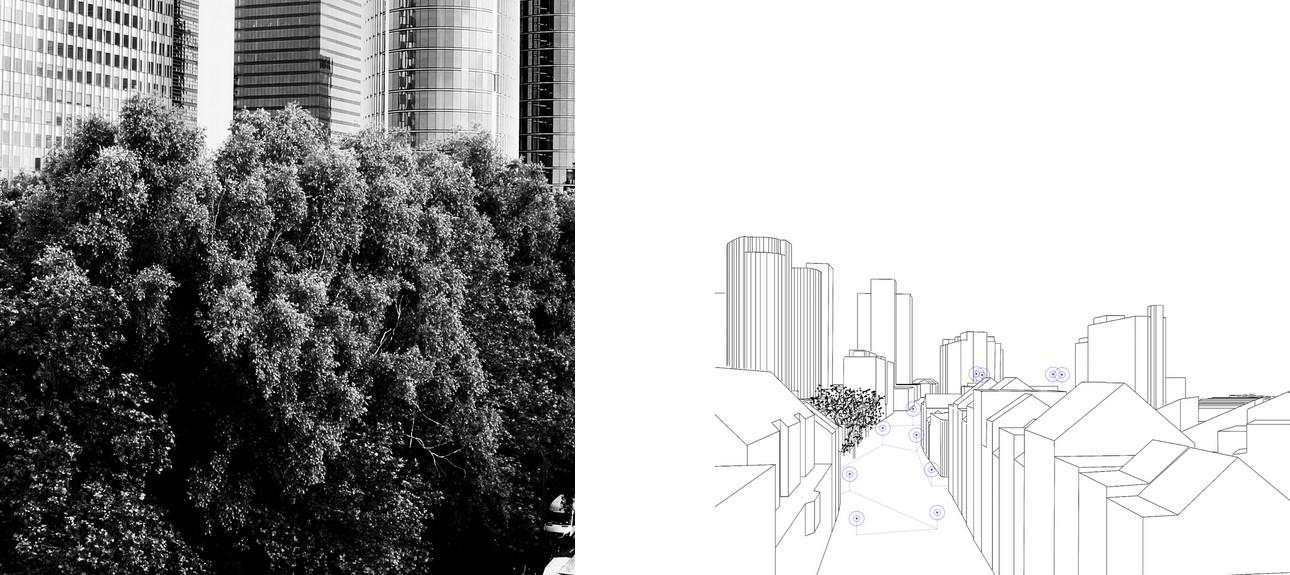


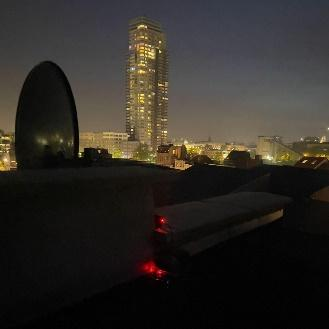
CDA Sonic Drift is an art and data driven audio essay tracing an AI-powered dérive that explores three sonic space shifts along the Chaussée d’Anvers (CDA) in Brussels Territory North, an area undergoing compact-city transformation. A Spatiotemporal Score structures the recordings across locations (Garden, Helihaven Avenue, Masui Street; Rooftop / Sidewalk) and times (sunrise, sunset, midnight). Active sonic walks register proximate textures—including infra-sound—while GDPR-compliant rooftop logging captures the broader acoustic horizon. In collaboration with CERTH, an AI pipeline (AER + USS) processes the material, and a GIS layer visualizes Sonic Space Shifts—affective changes in the urban environment that signal quality-of-life transitions.
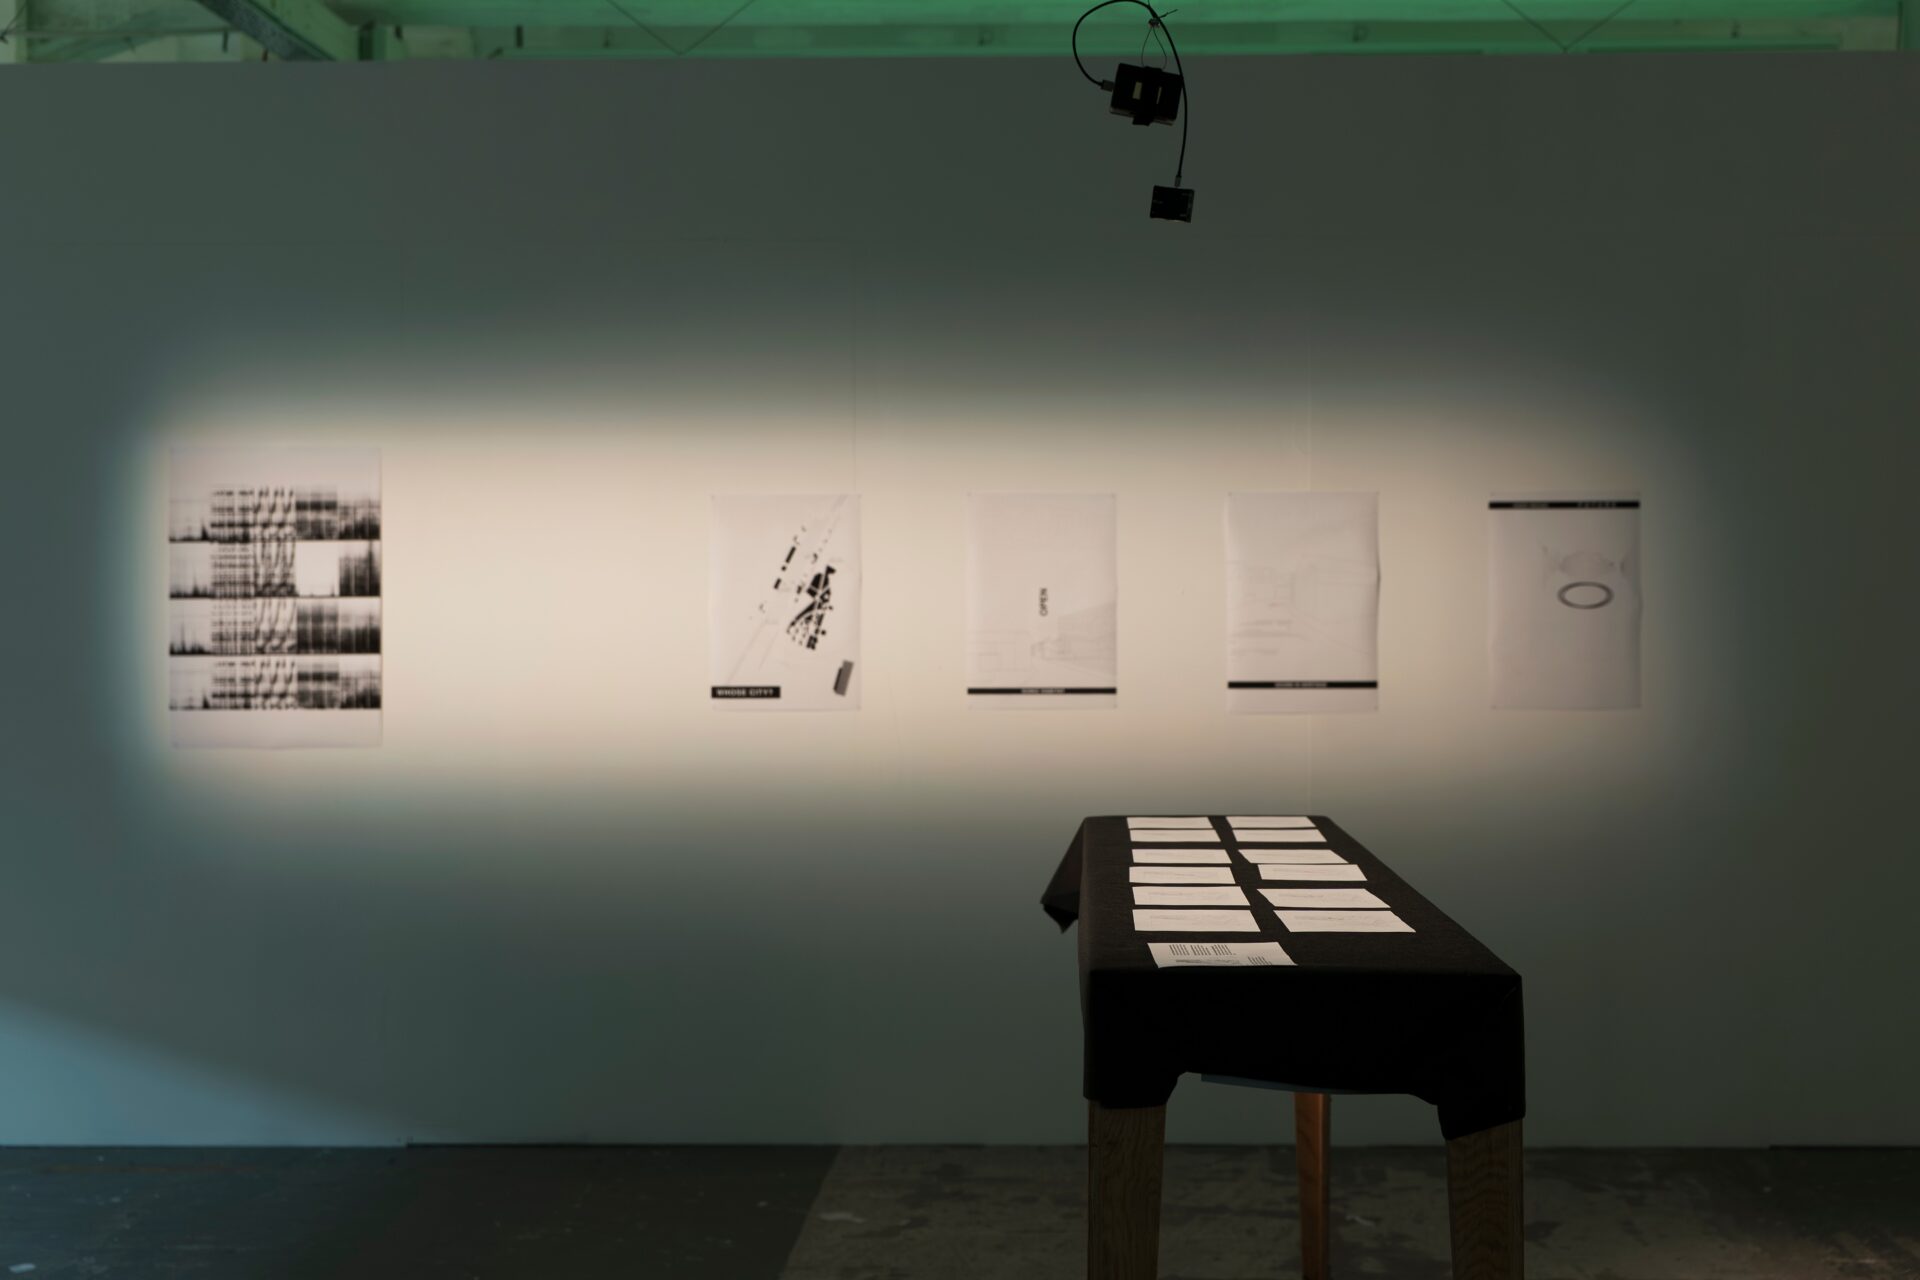
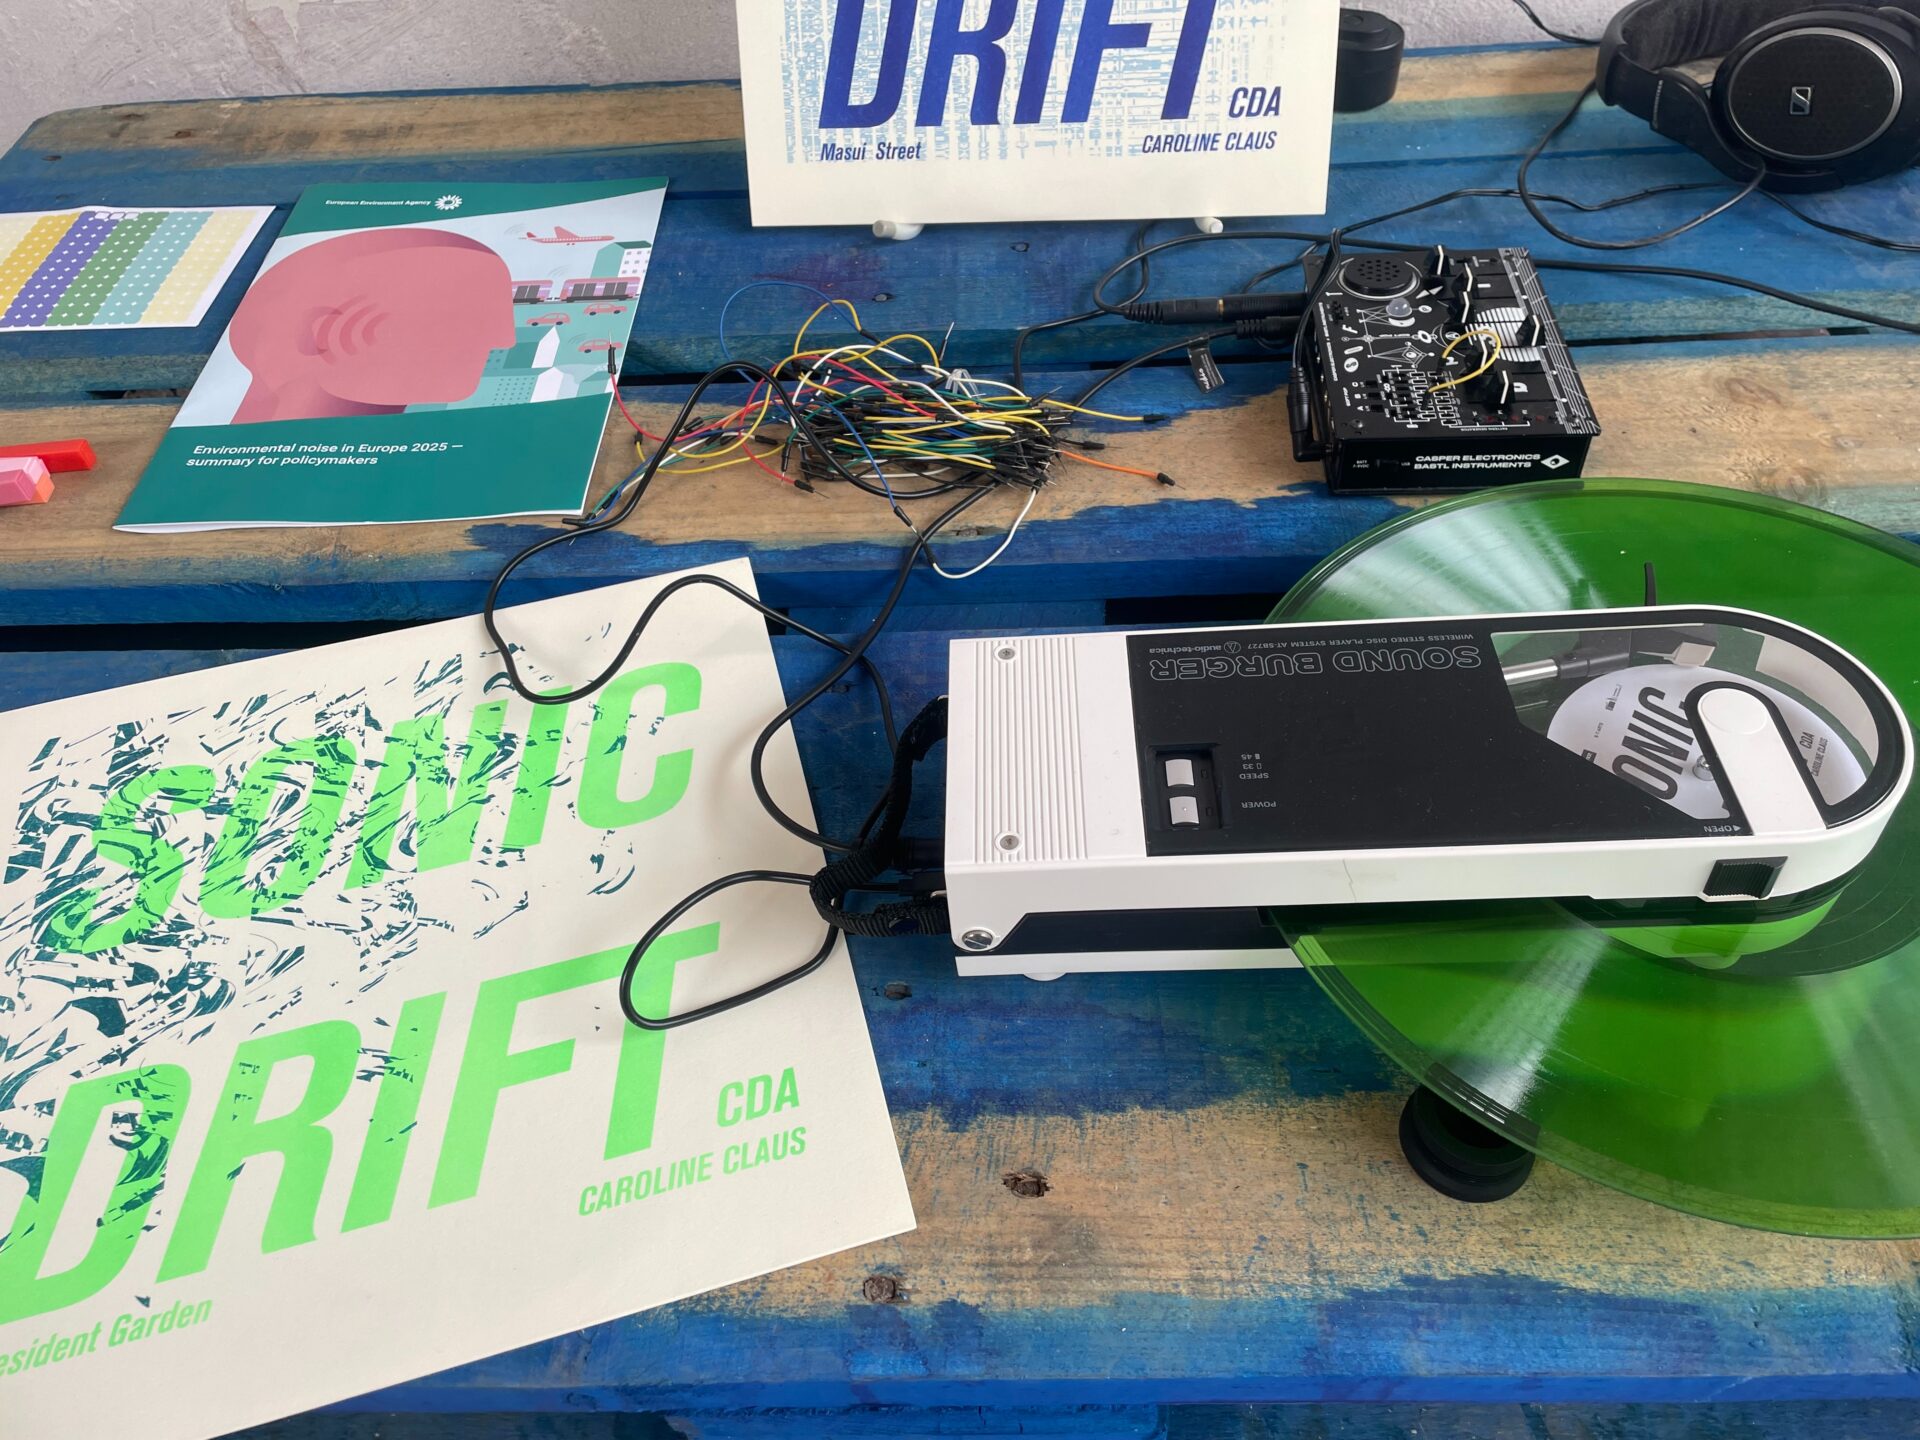
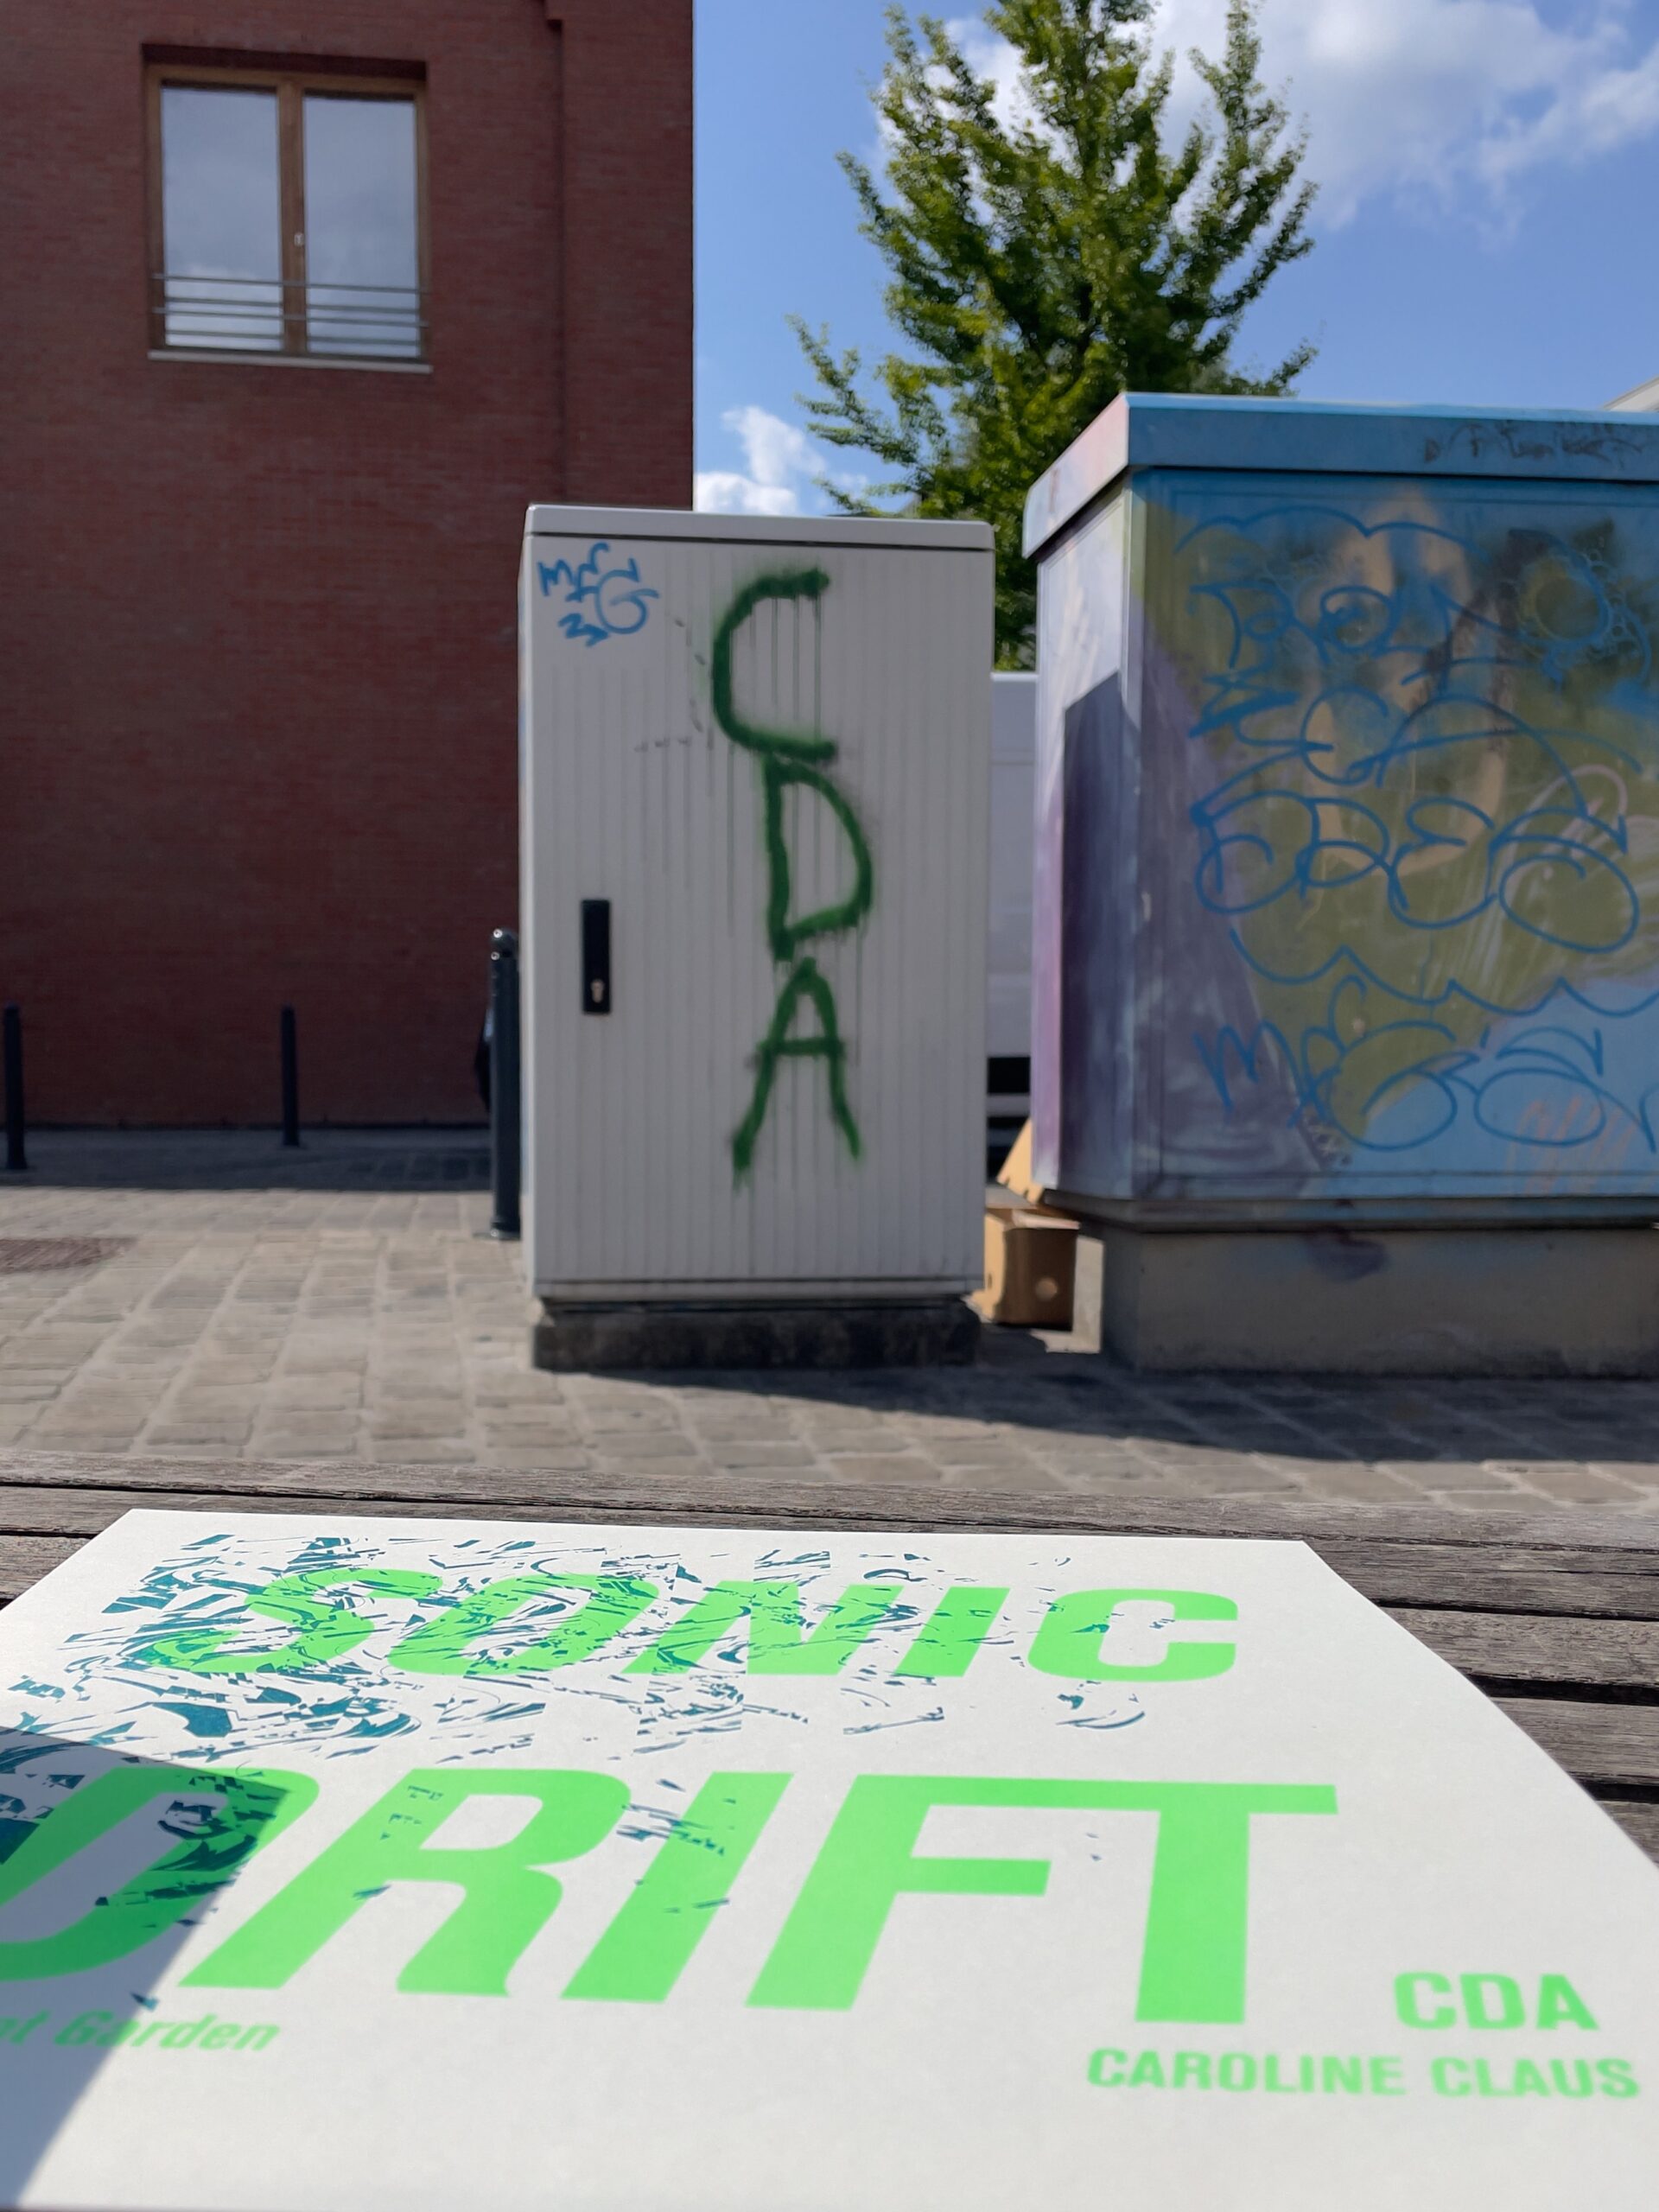
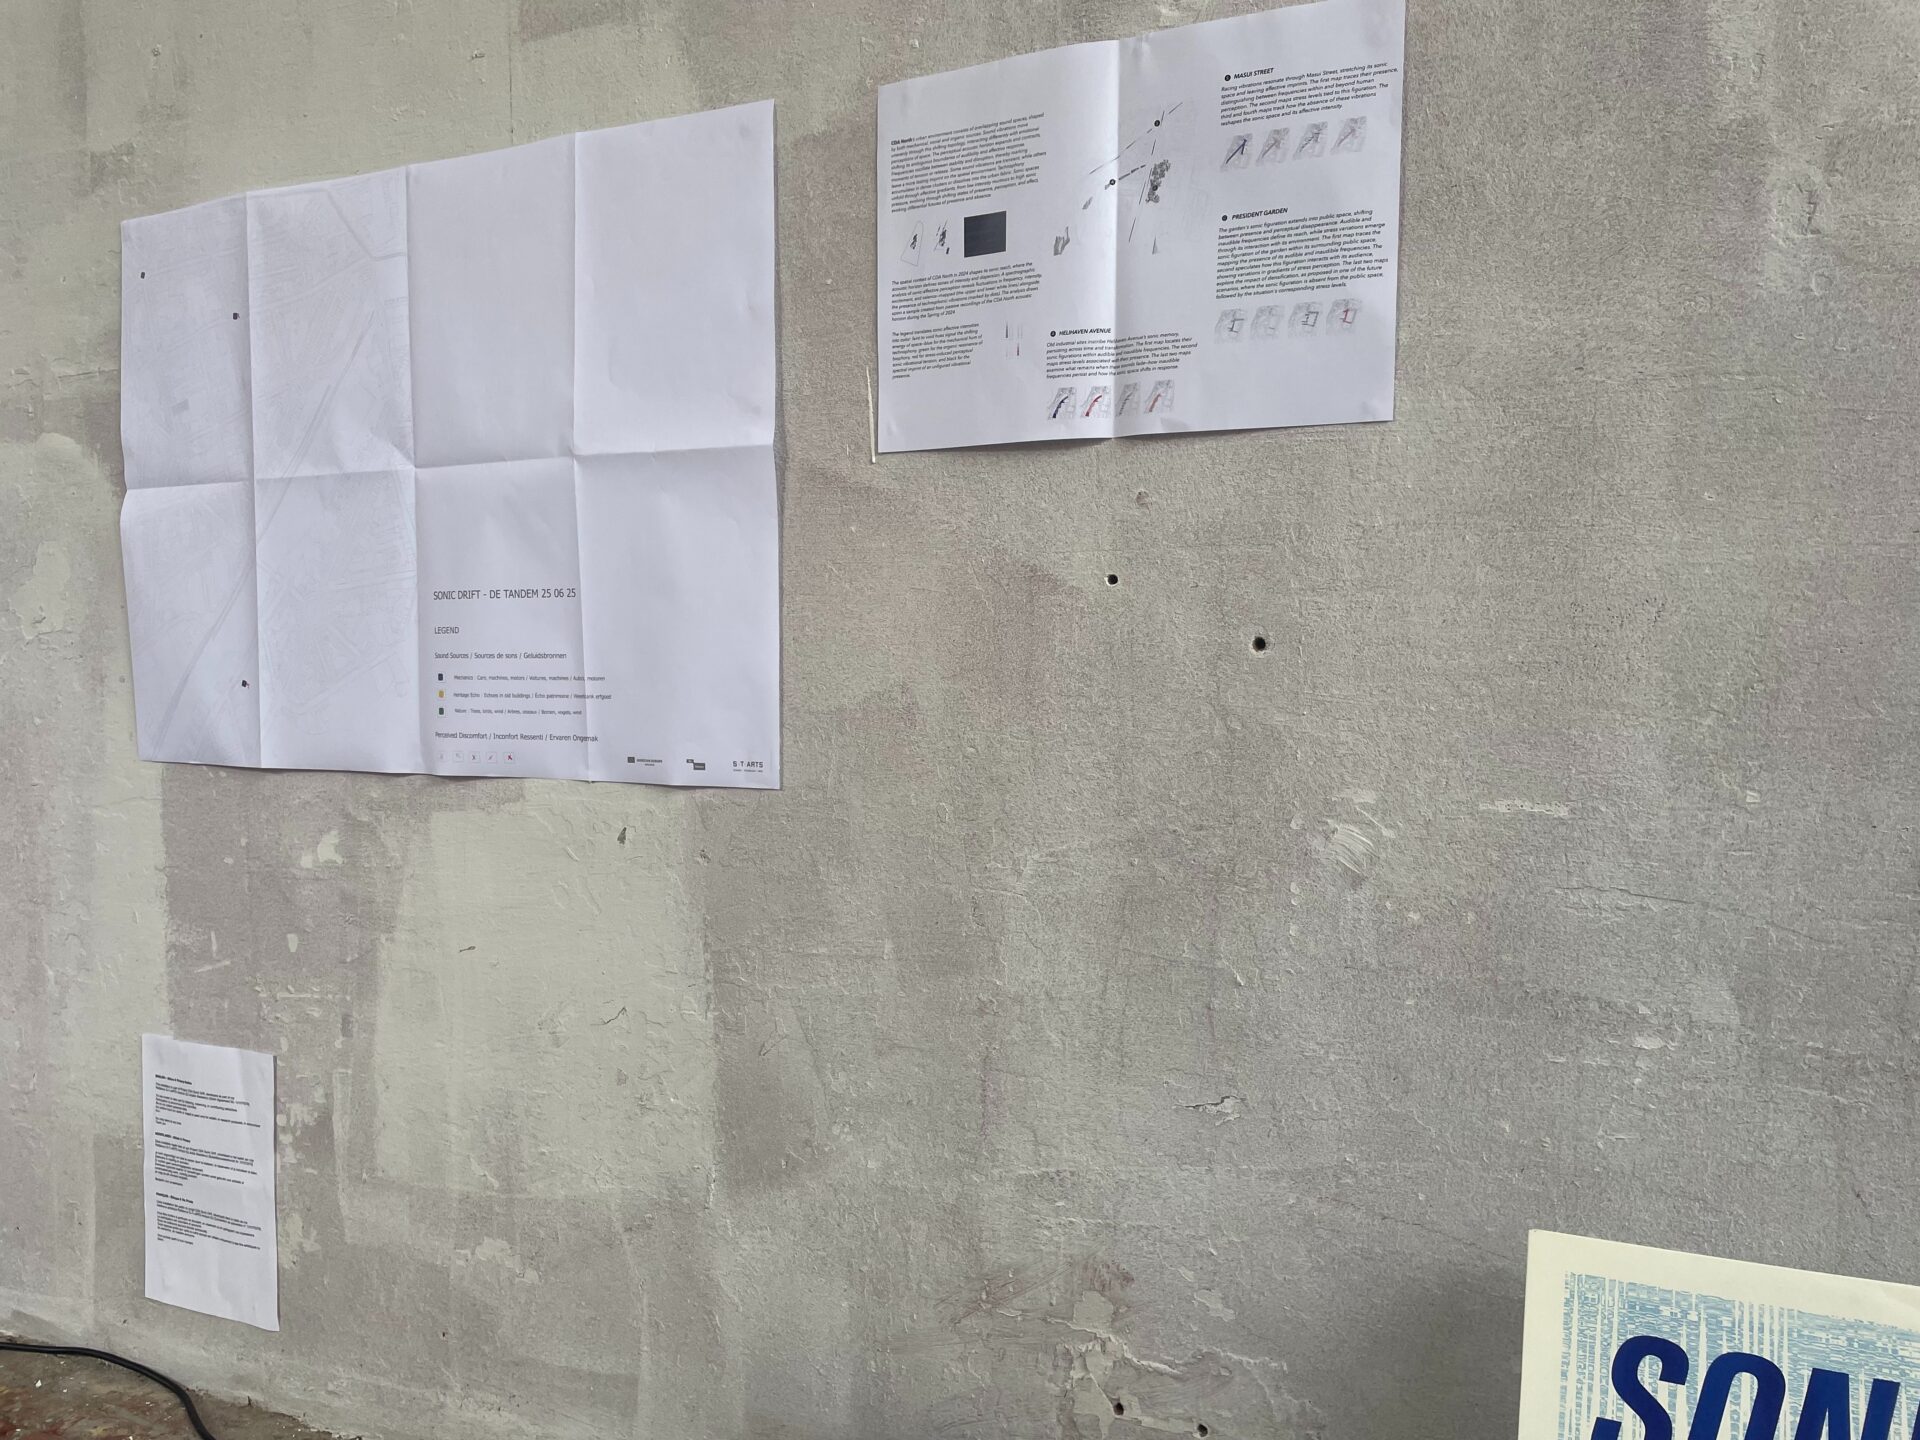
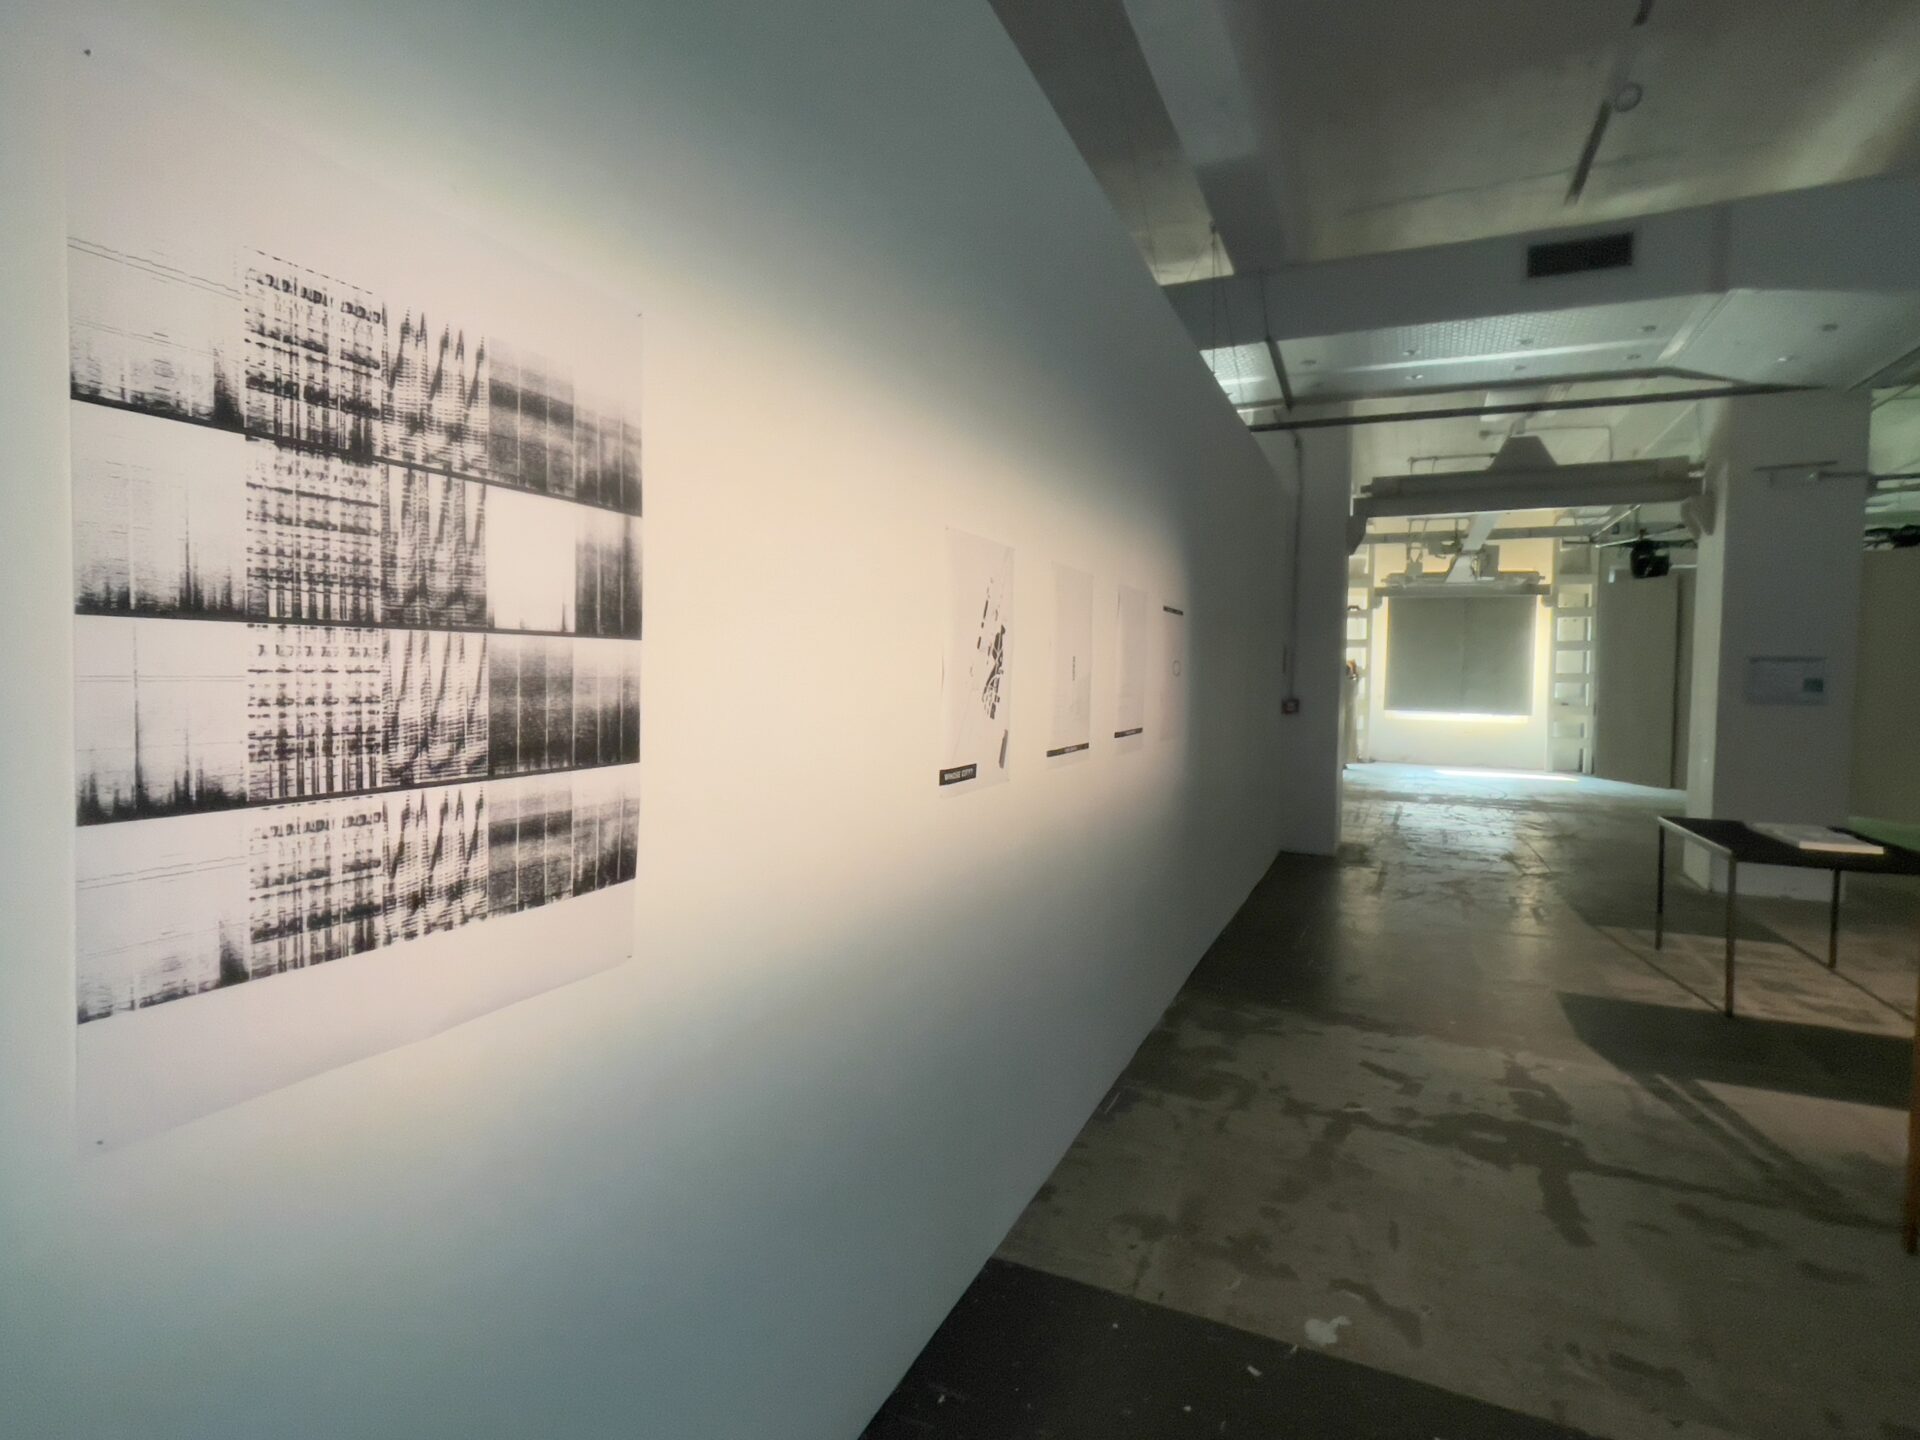
The audio essay translates this research into an immersive, multi-format installation. Three hand-cut dubplates—each corresponding to one of the study sites—are presented on a modular headphone deck for dedicated listening. A riso-printed score and GIS-derived comfort maps surround the listening setup, inviting annotation and audience reflection. This interactive format transforms the analytical findings into a sensory experience, creating a space for public engagement, feedback, and situated discussion on the sonic and affective dimensions of urban transformation. The installation premiered at the ReSilence Exhibition, BASE Milano (October 2025).
Challenges Addressed
1. Sonic Space Shift analysis as compact-city planning assessment.
2. Site recording that combines active and passive methods, including infra-/ultra-sonic approaches, while remaining GDPR-compliant.
3. Translating sensory findings into qualitative and quantitative descriptors credible to planners, designers, and residents.
4. Integrating strategic, situated, and participatory sonic explorations with data-driven tools in a single workflow.
Urban Dimension
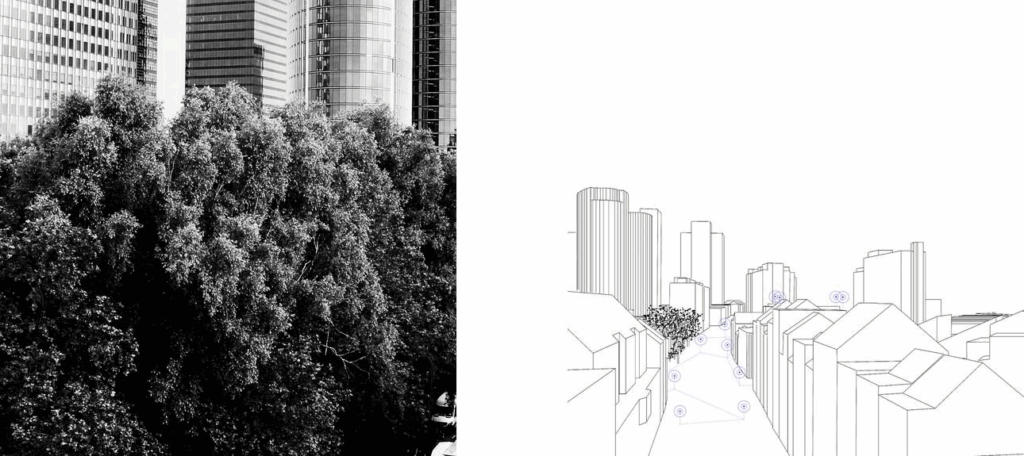
The Chaussée d’Anvers (CDA) block typifies old industrial railway and port-heritage fabrics, car-dominated mobility, and limited access to greenspace. Sonic comfort grids explore trade-offs between densification, corridors of movement, and acoustic well-being.
Collaborations
– CERTH (AI & devices; Dec 2023–Jul 2024 sprints)
– ReSonance Open Sound Lab (Pilot #1 – feedback session)
– Christophe Albertijn (mastering)
– Dubplate Lab (dubplate cut)
– Chez Rosi (Riso print & sleeve design)
– De Tandem (Pilot #2)
sonic space shifts, compact-city soundscape, AI audio analysis, GIS comfort grid, participatory mapping, dubplate listening, GDPR logging
Sonic Space Shift Analysis (Workflow)
– Method & Score (IP: Artist): Conceptual framework and Spatiotemporal Score for compact-city scenario testing; geocoded data model; GIS cartography; mixed-media installation.
– AI Analysis (IP: CERTH): Selection and integration of AER / USS algorithms; statistical analysis; comfort-over-time traces; domain inference (biophony / anthropophony / technophony).
– Joint Addition (Co-developed): Subsonic & Ultrasonic Substrate category to include infra-/ultra-sonic ranges (reported as LAeq dB where applicable).
Geocoding & Geospatial Workflow
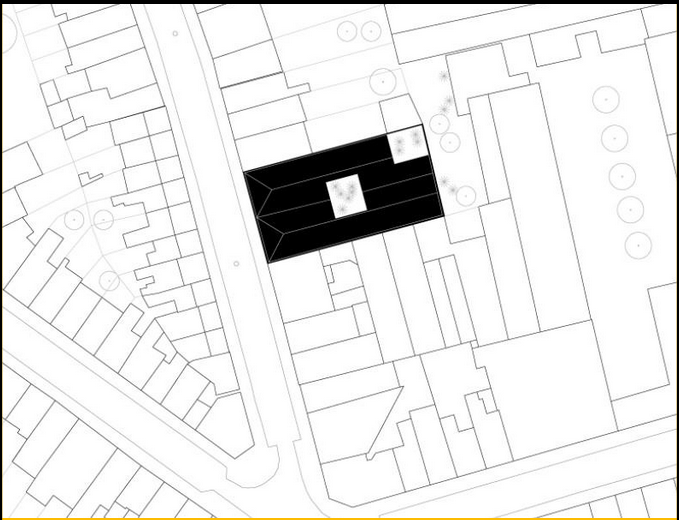
– Geocoding: All recordings (active & passive) are linked to score positions and times; walk paths and rooftop logger sites are encoded as layers (points / lines / polygons) with observation notes. (Artist)
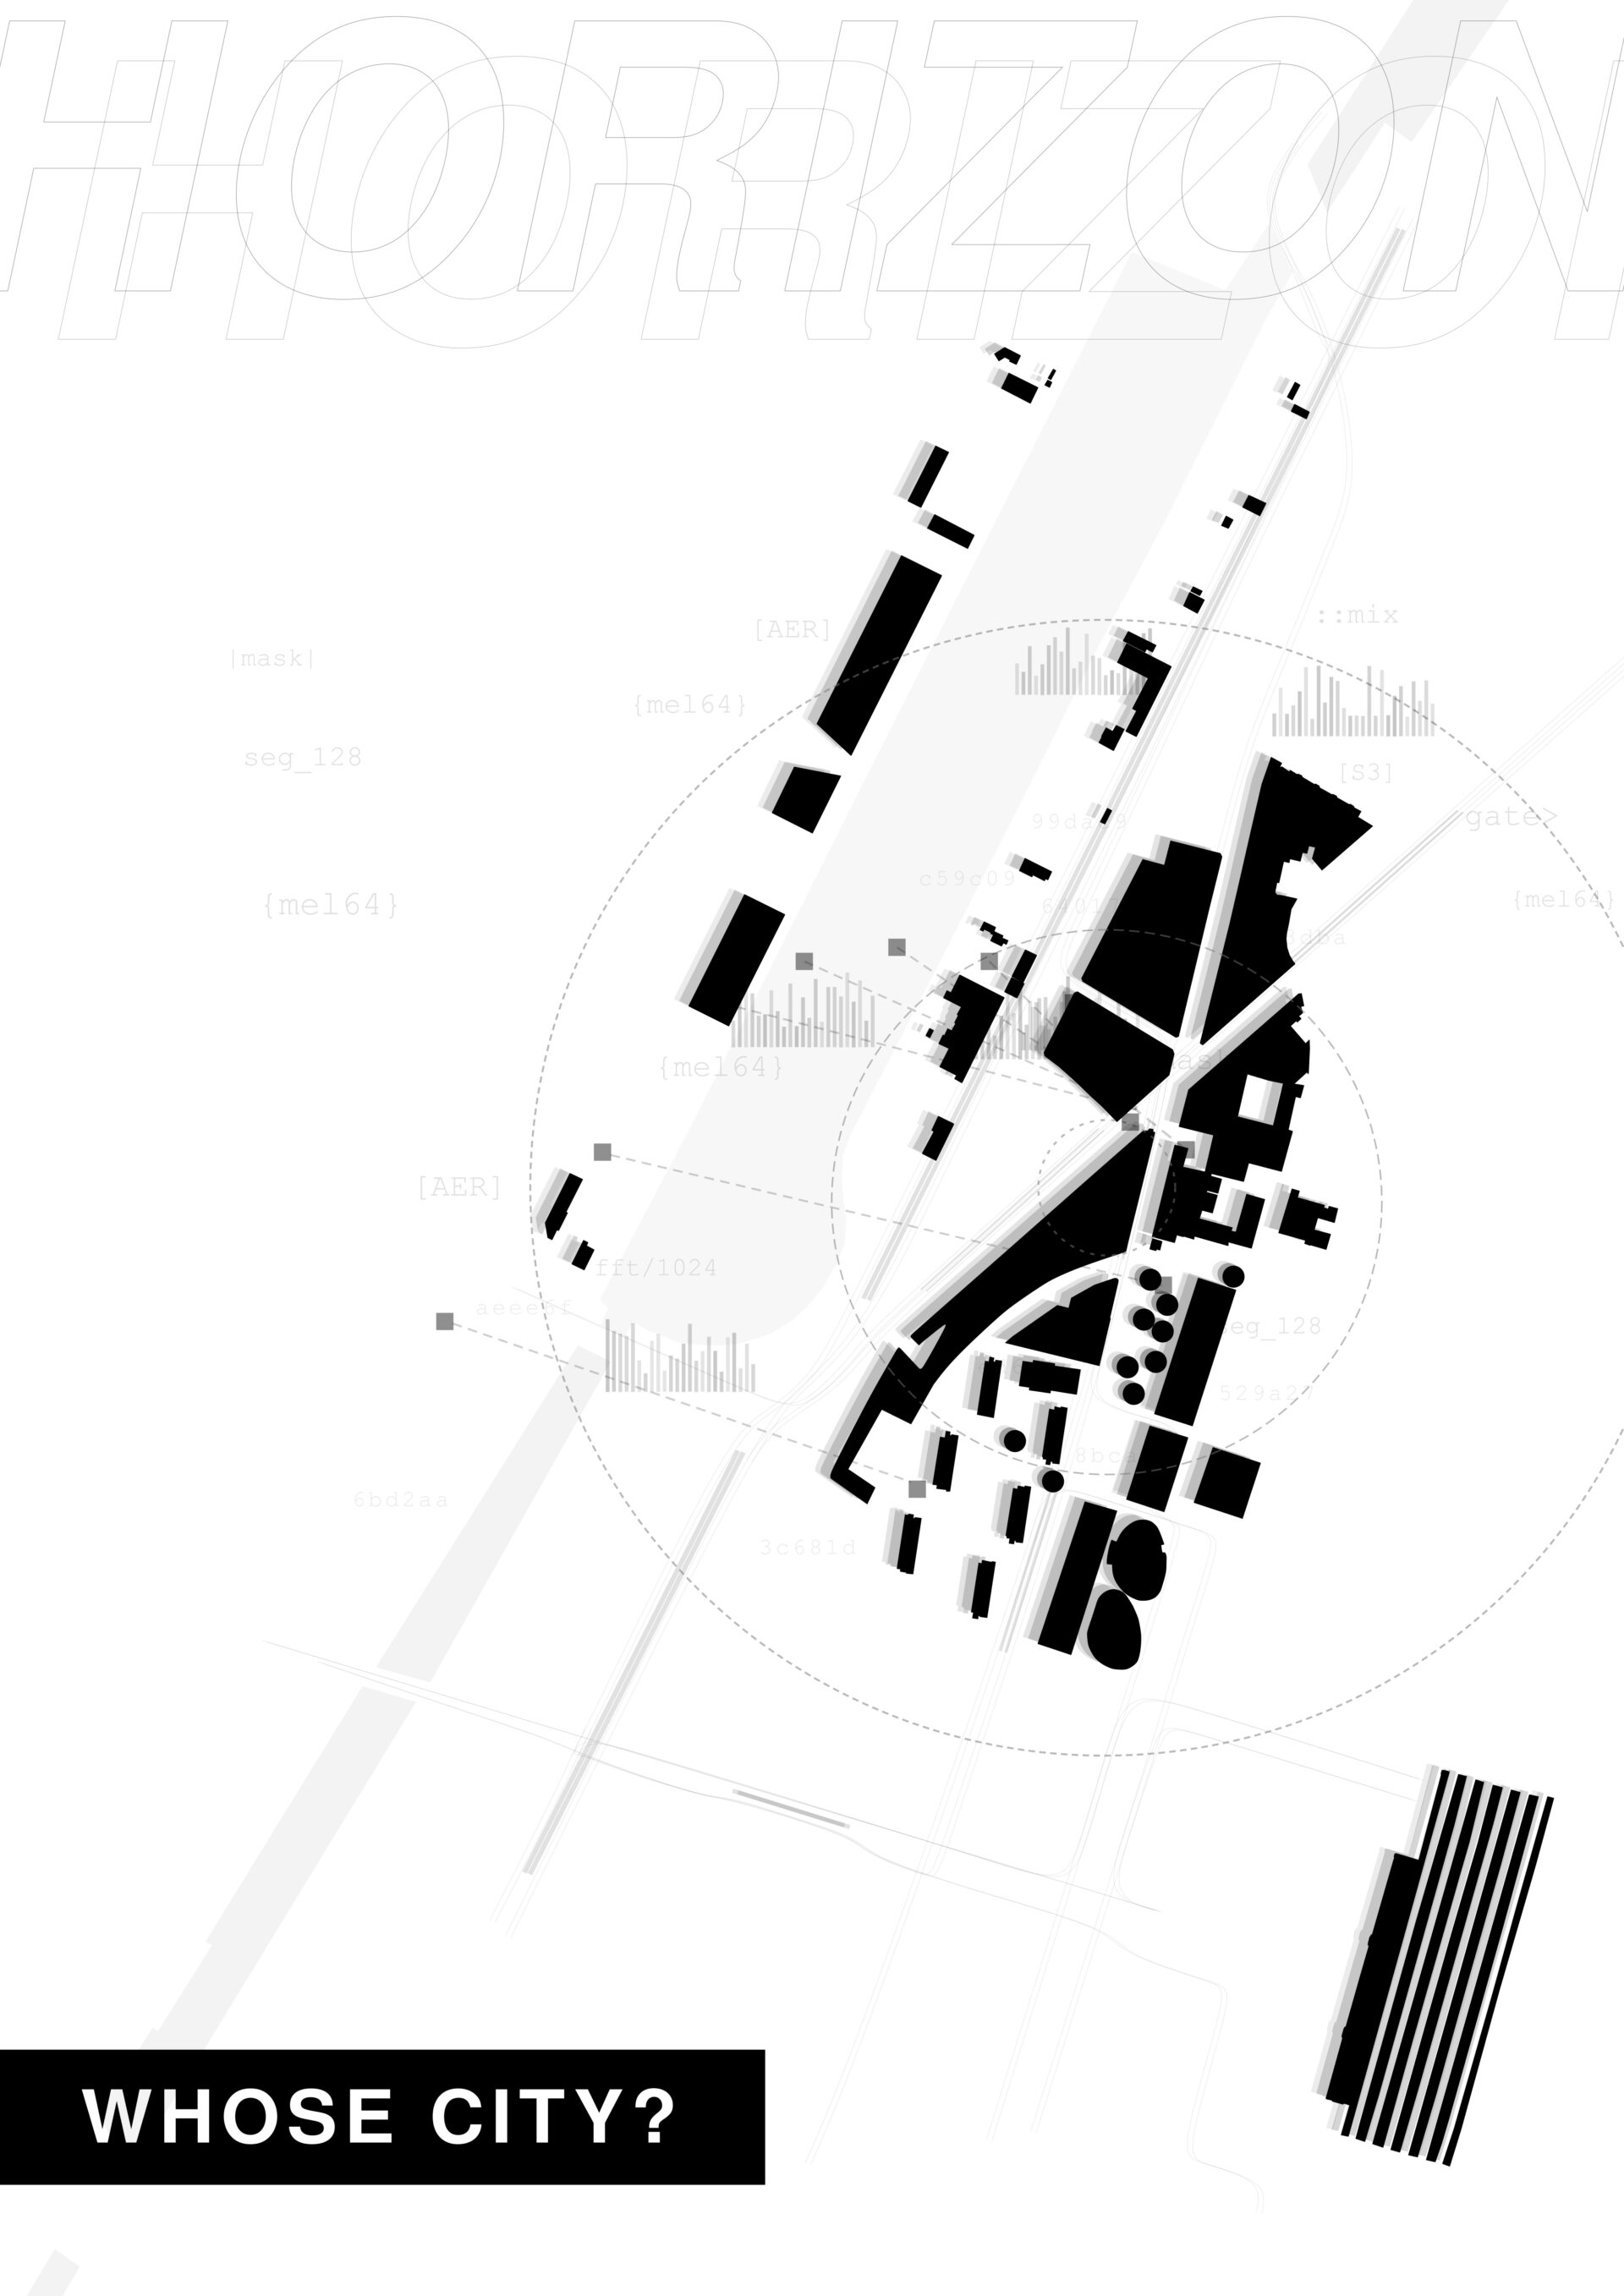
– GIS Authoring: QGIS (open-source) is used for viewing, editing, analysis, and generating print-ready GIS / SVG comfort grids; ethnographic observations and AI outputs are integrated into planner-ready layers. (Artist)
– Cartographic Products: Comfort grids, domain presence maps, VA (Valence–Arousal) traces, and site overlays for Garden / Helihaven / Masui. (Artist)
Audio Recording Methods & Tools
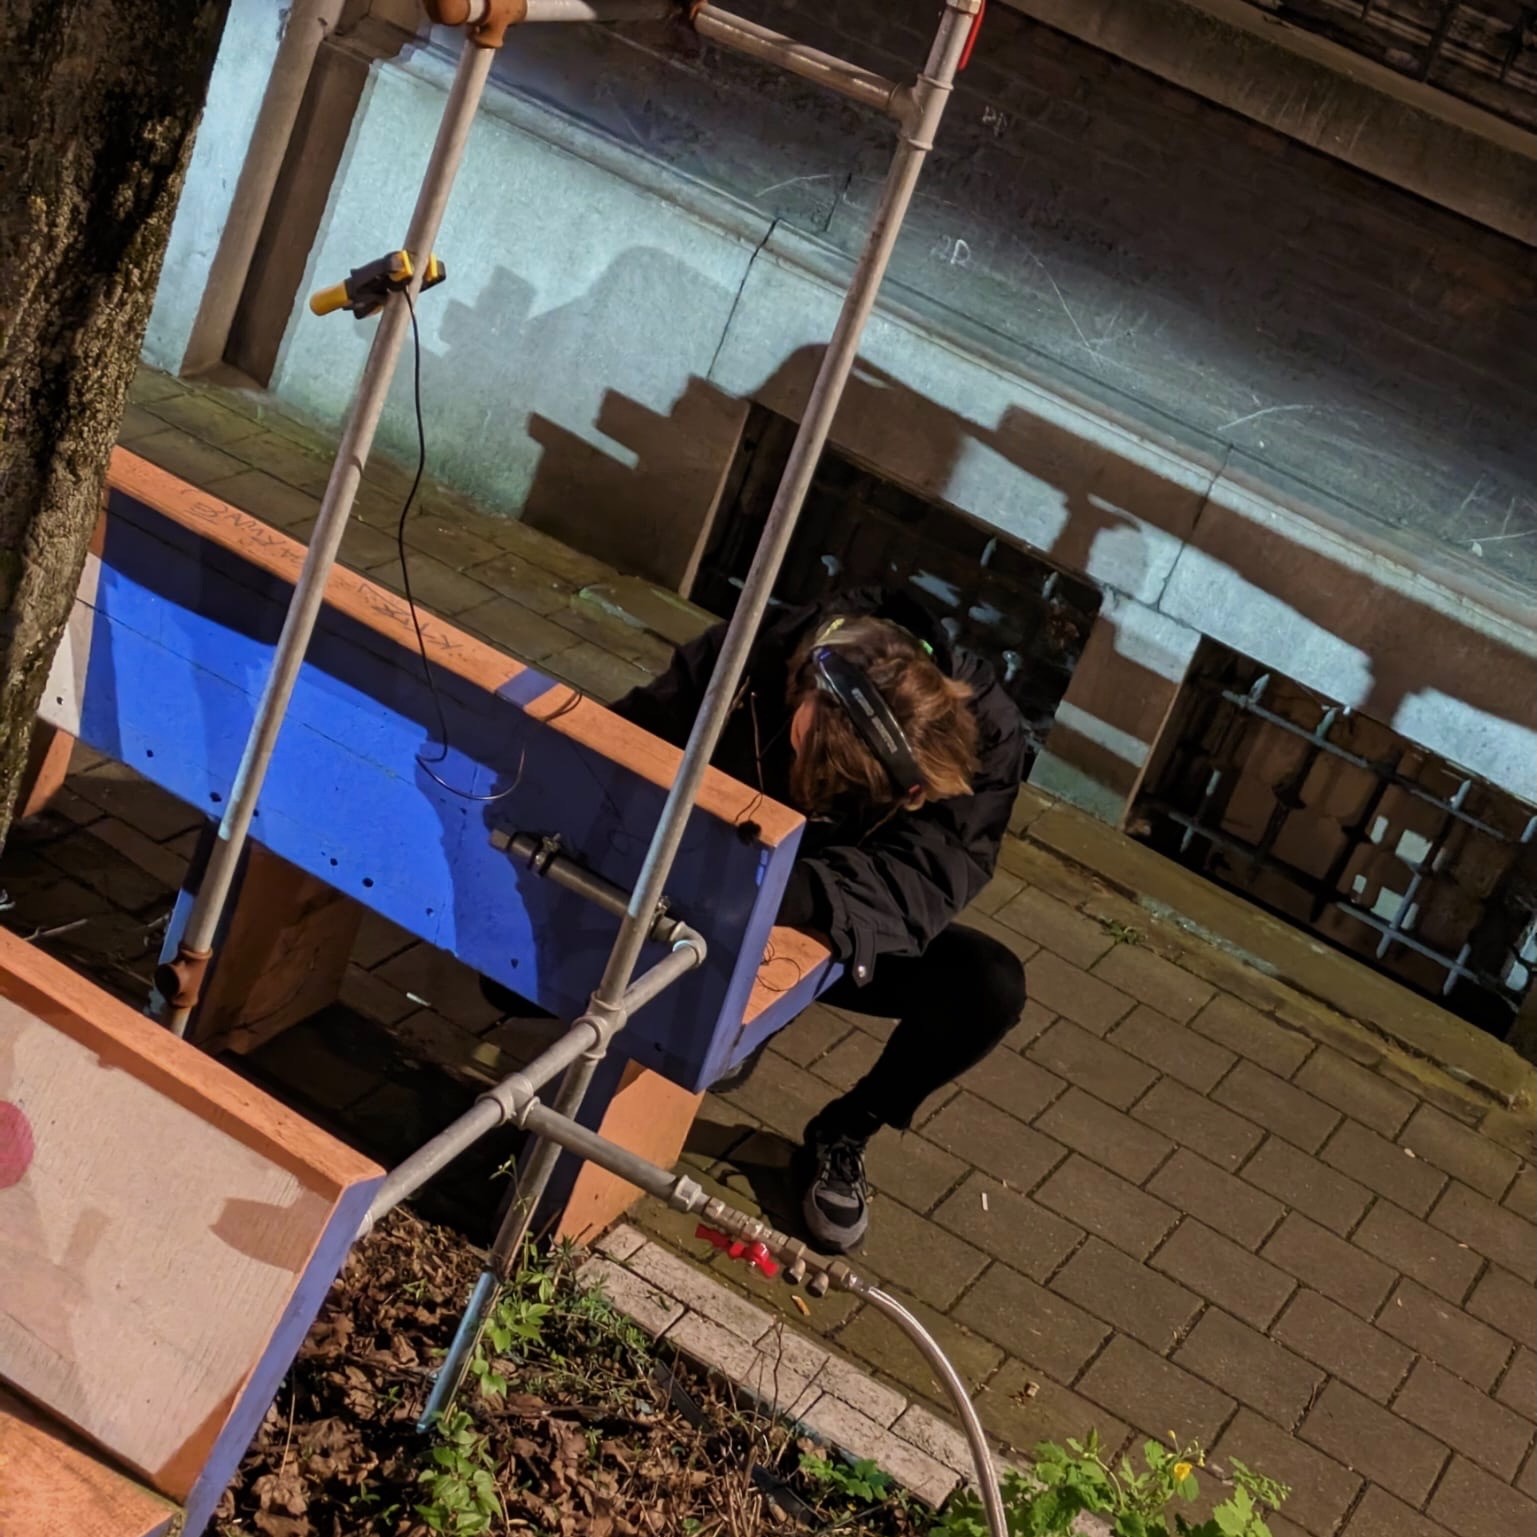
– Passive (rooftops) and Active (street-level walks) using contact, shotgun, and omnidirectional microphones, and a high-quality recorder. (IP split: field method & Score by Artist; passive data logging and monitoring device network system by CERTH)
– Scheduling: Sunrise / sunset / midnight aligned with the Score to capture temporal change.
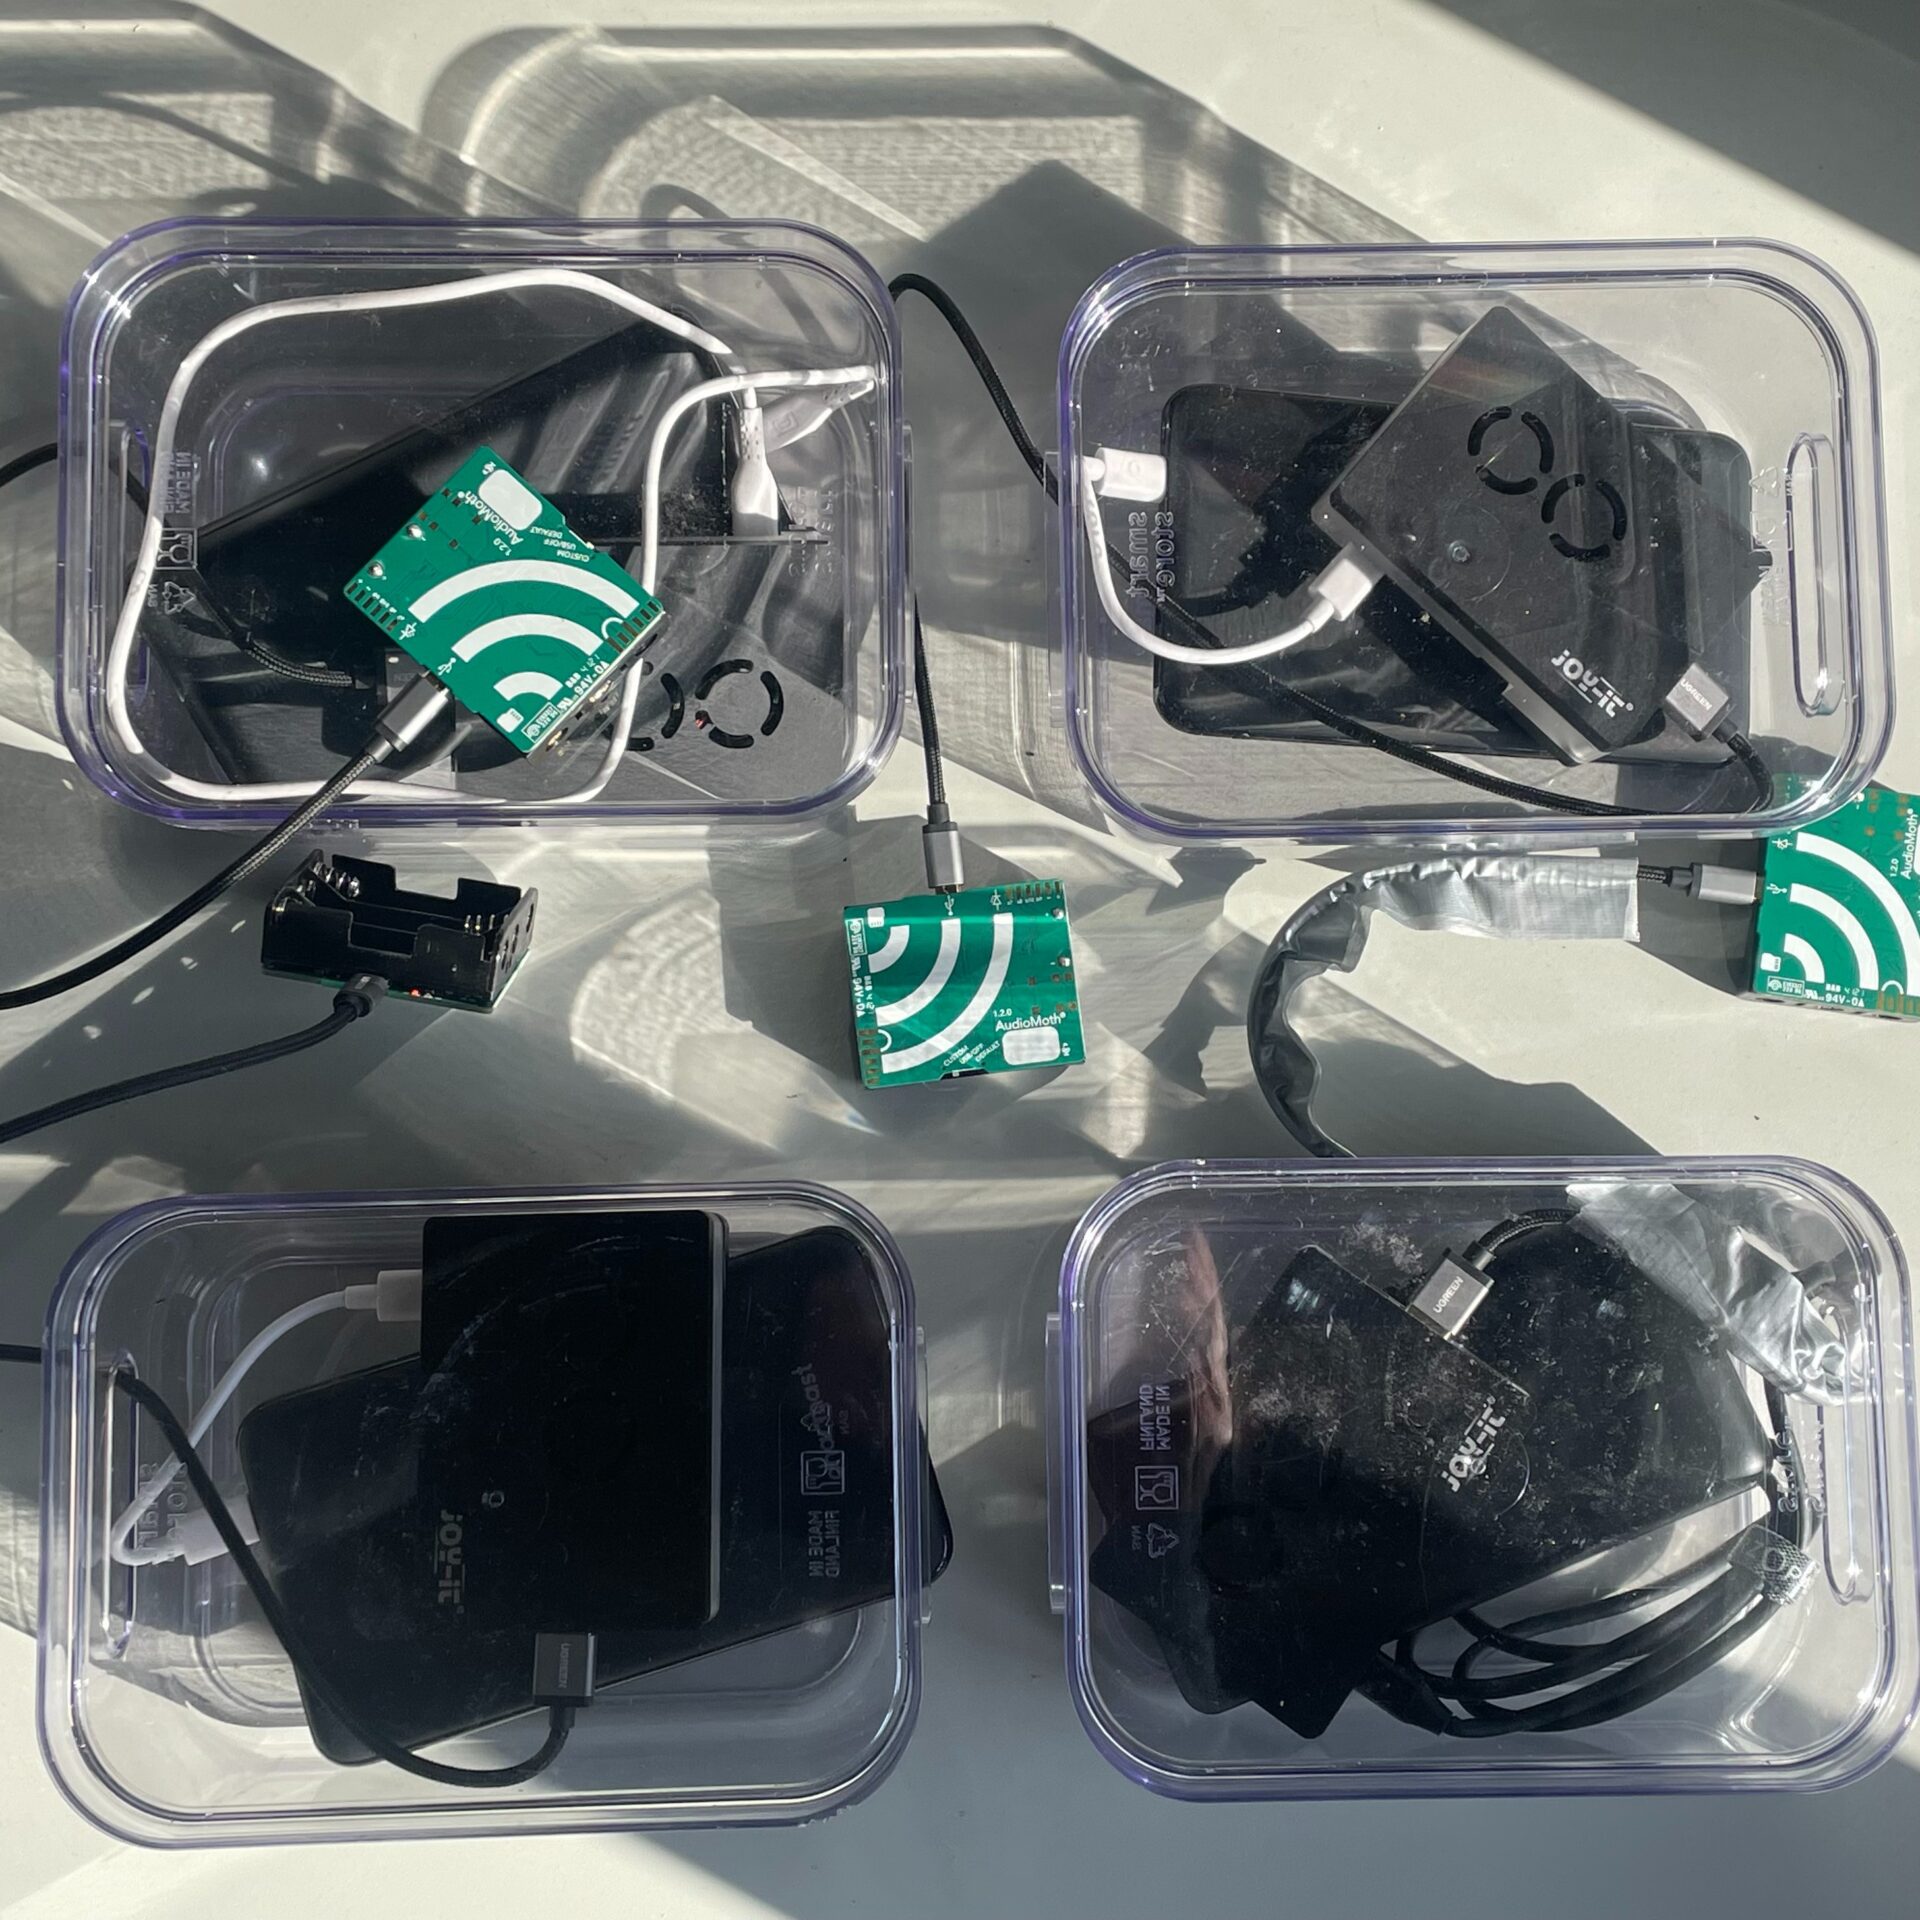
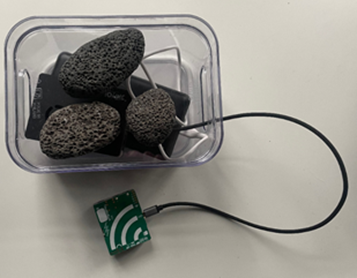
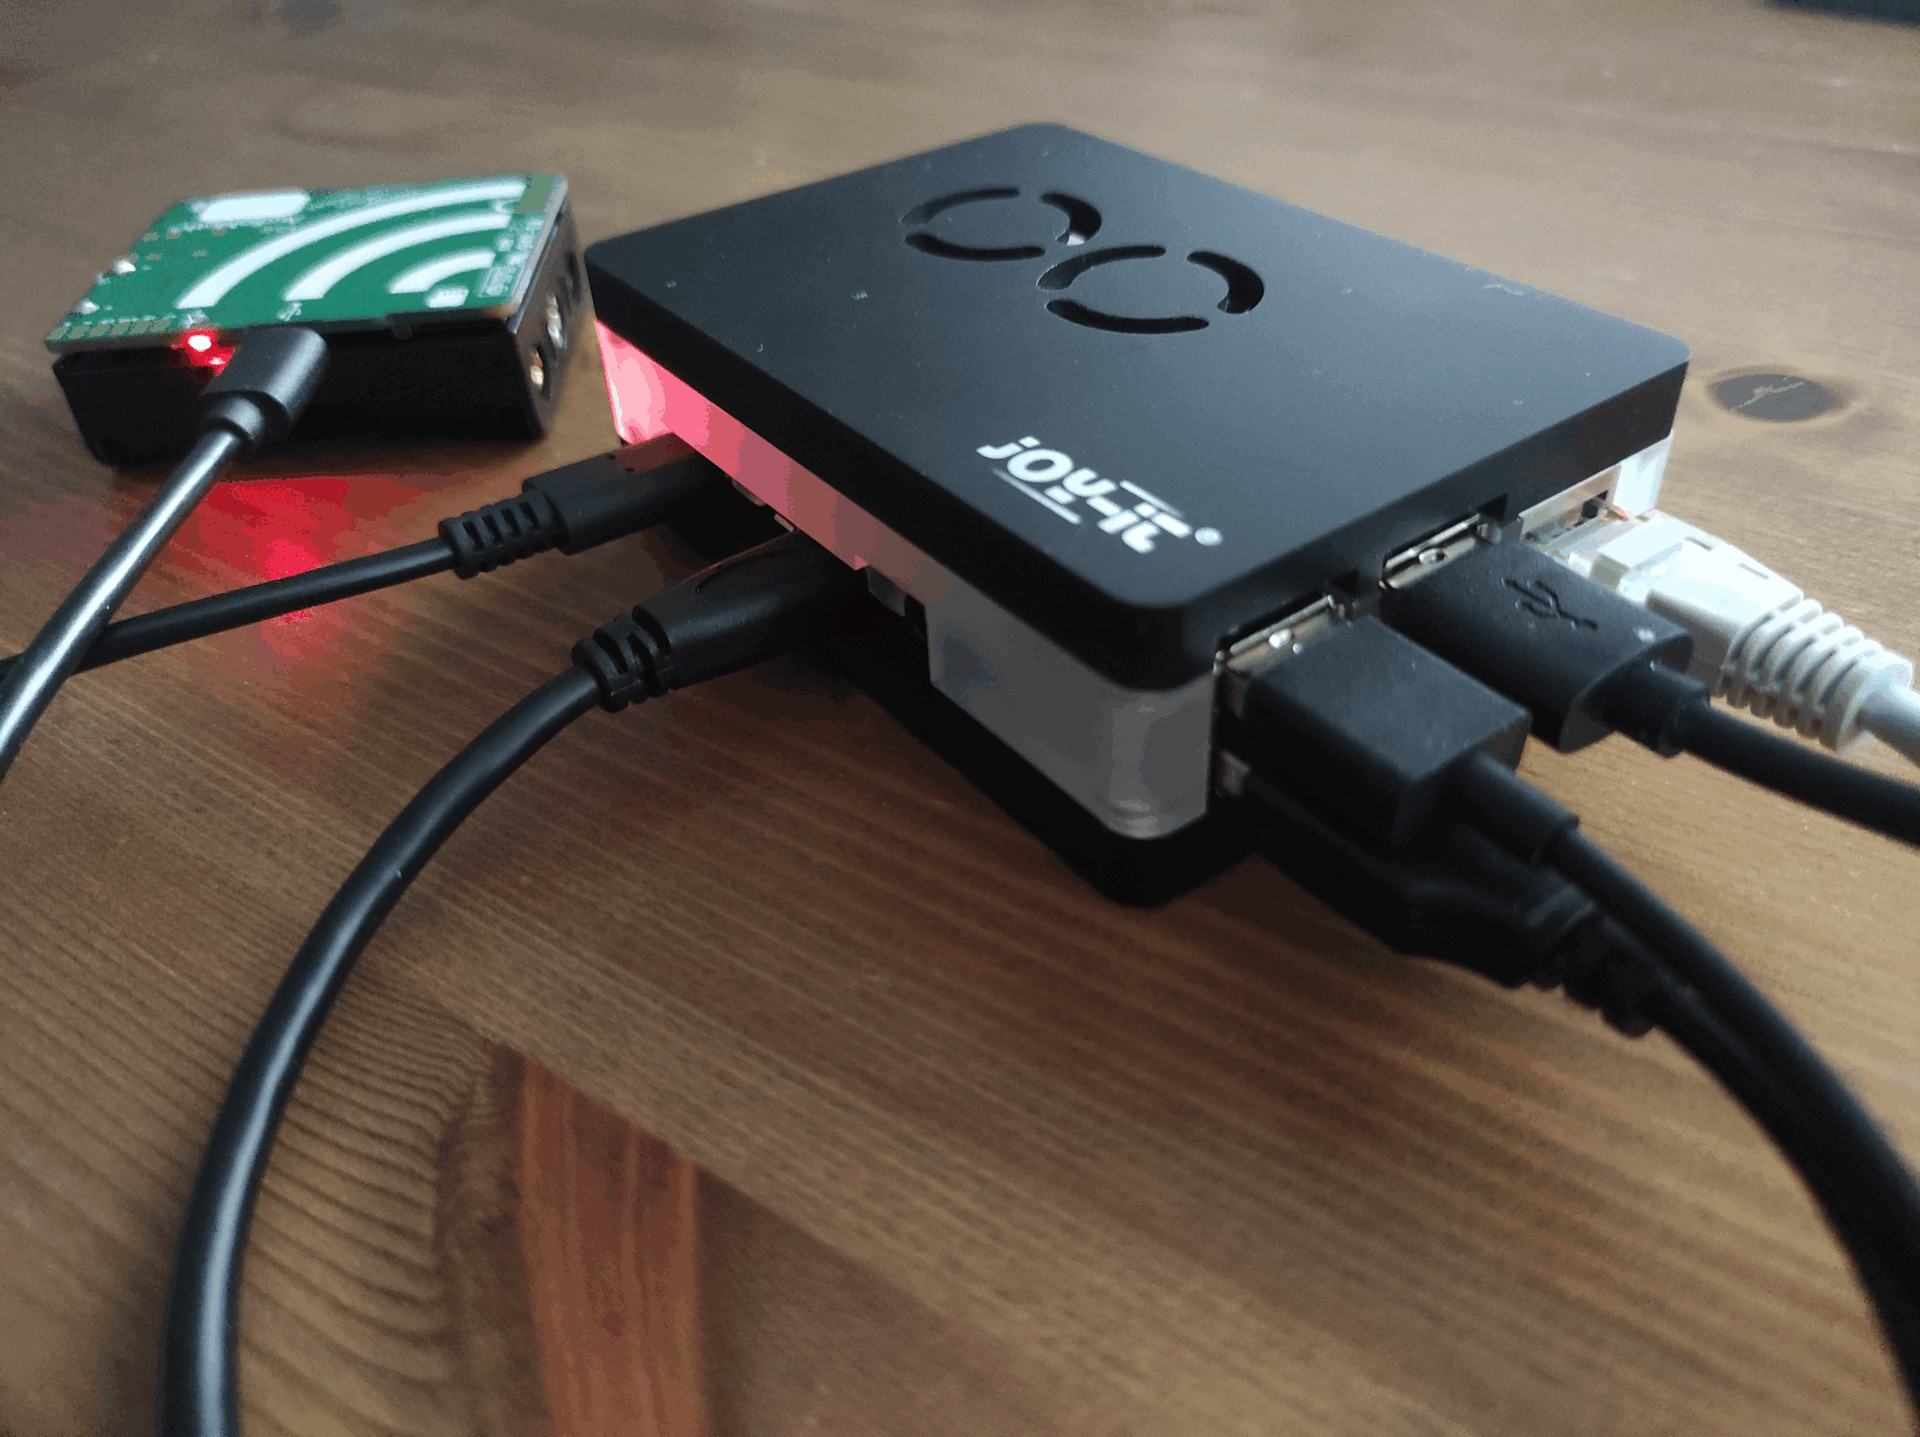
(Privacy-by-Design)– GDPR Rooftop Logger (IP: CERTH):
On-device, low-energy voice obfuscation in real time to protect privacy while preserving environmental integrity.
Hardware: Raspberry Pi 4B + AudioMoth (mic) + power bank (portable).
– CDA-North Active and Passive Recording Samples (scored geocode tags) — IP: Artist
– CDA Multitrack Set (incl. open-source audio editing workflow) — IP: Artist
– CDA-North Time based labels of passive recording samples, AER / USS Labels & GDPR software configurations — IP: CERTH
Statistical Analysis (Metrics)
(Analysis and metric design conducted by CERTH. Metric selection and artistic relevance reviewed and curated in dialogue with the Artist.)
1. Stress / Calm Levels (AER, VA model):
Measures perceived affect on a 2D Valence–Arousal diagram, indicating how stressful or calming a recording segment is. Values are normalized on a 0–1 scale.
2. Sonic Space Presence (USS, domain inference):
Source separation estimates domain presence across biophony / anthropophony / technophony; intensity calibrated on a 0–1.414 range.
3. Subsonic & Ultrasonic Substrate (Co-developed):
Frequency analysis identifies subsonic / ultrasonic components reported as LAeq dB; included at the artist’s request to account for vibrational substrates affecting acoustic dis/comfort.
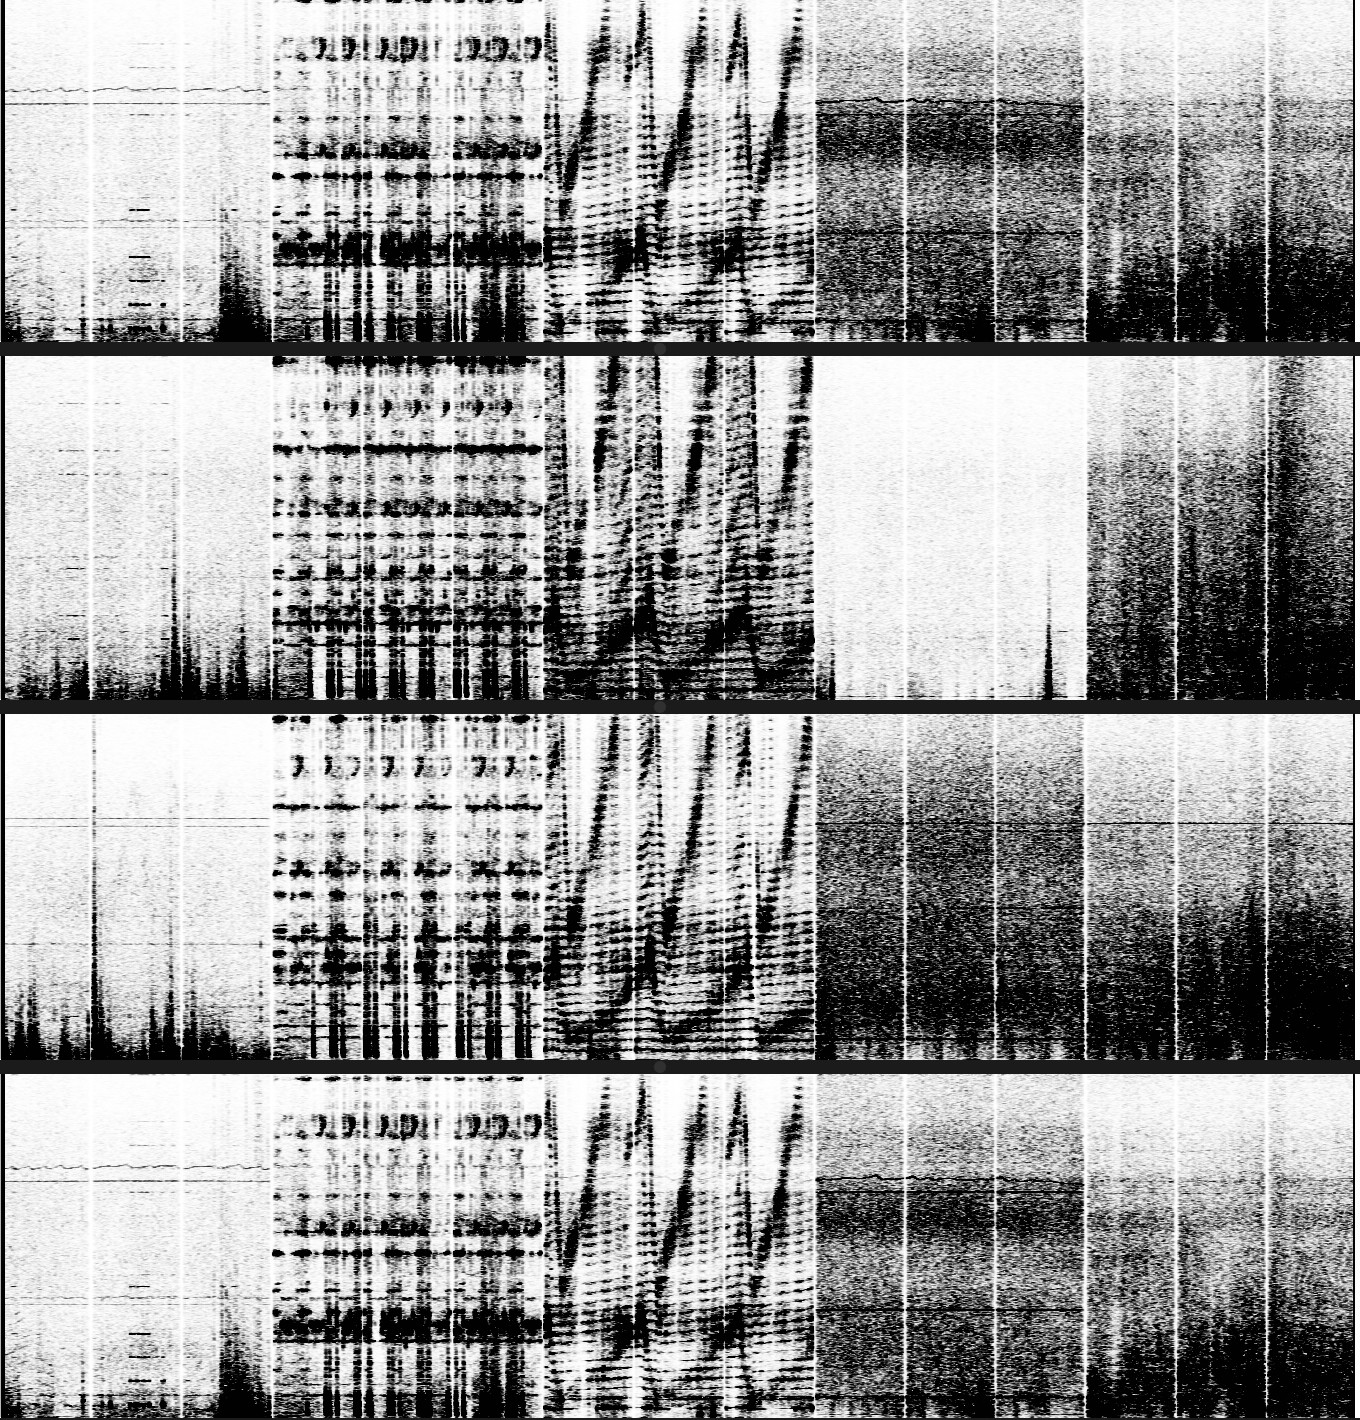
Outputs are aggregated for the three pilot spaces (Garden, Helihaven, Masui) and visualized as dis/comfort-over-time traces, spectrograms, and GIS overlays by the artist.
Audio Essay (Feedback Installation)
Audio Essay Production: Three stereo mixes developed from active and passive field recordings (mastering by Christophe Albertijn)
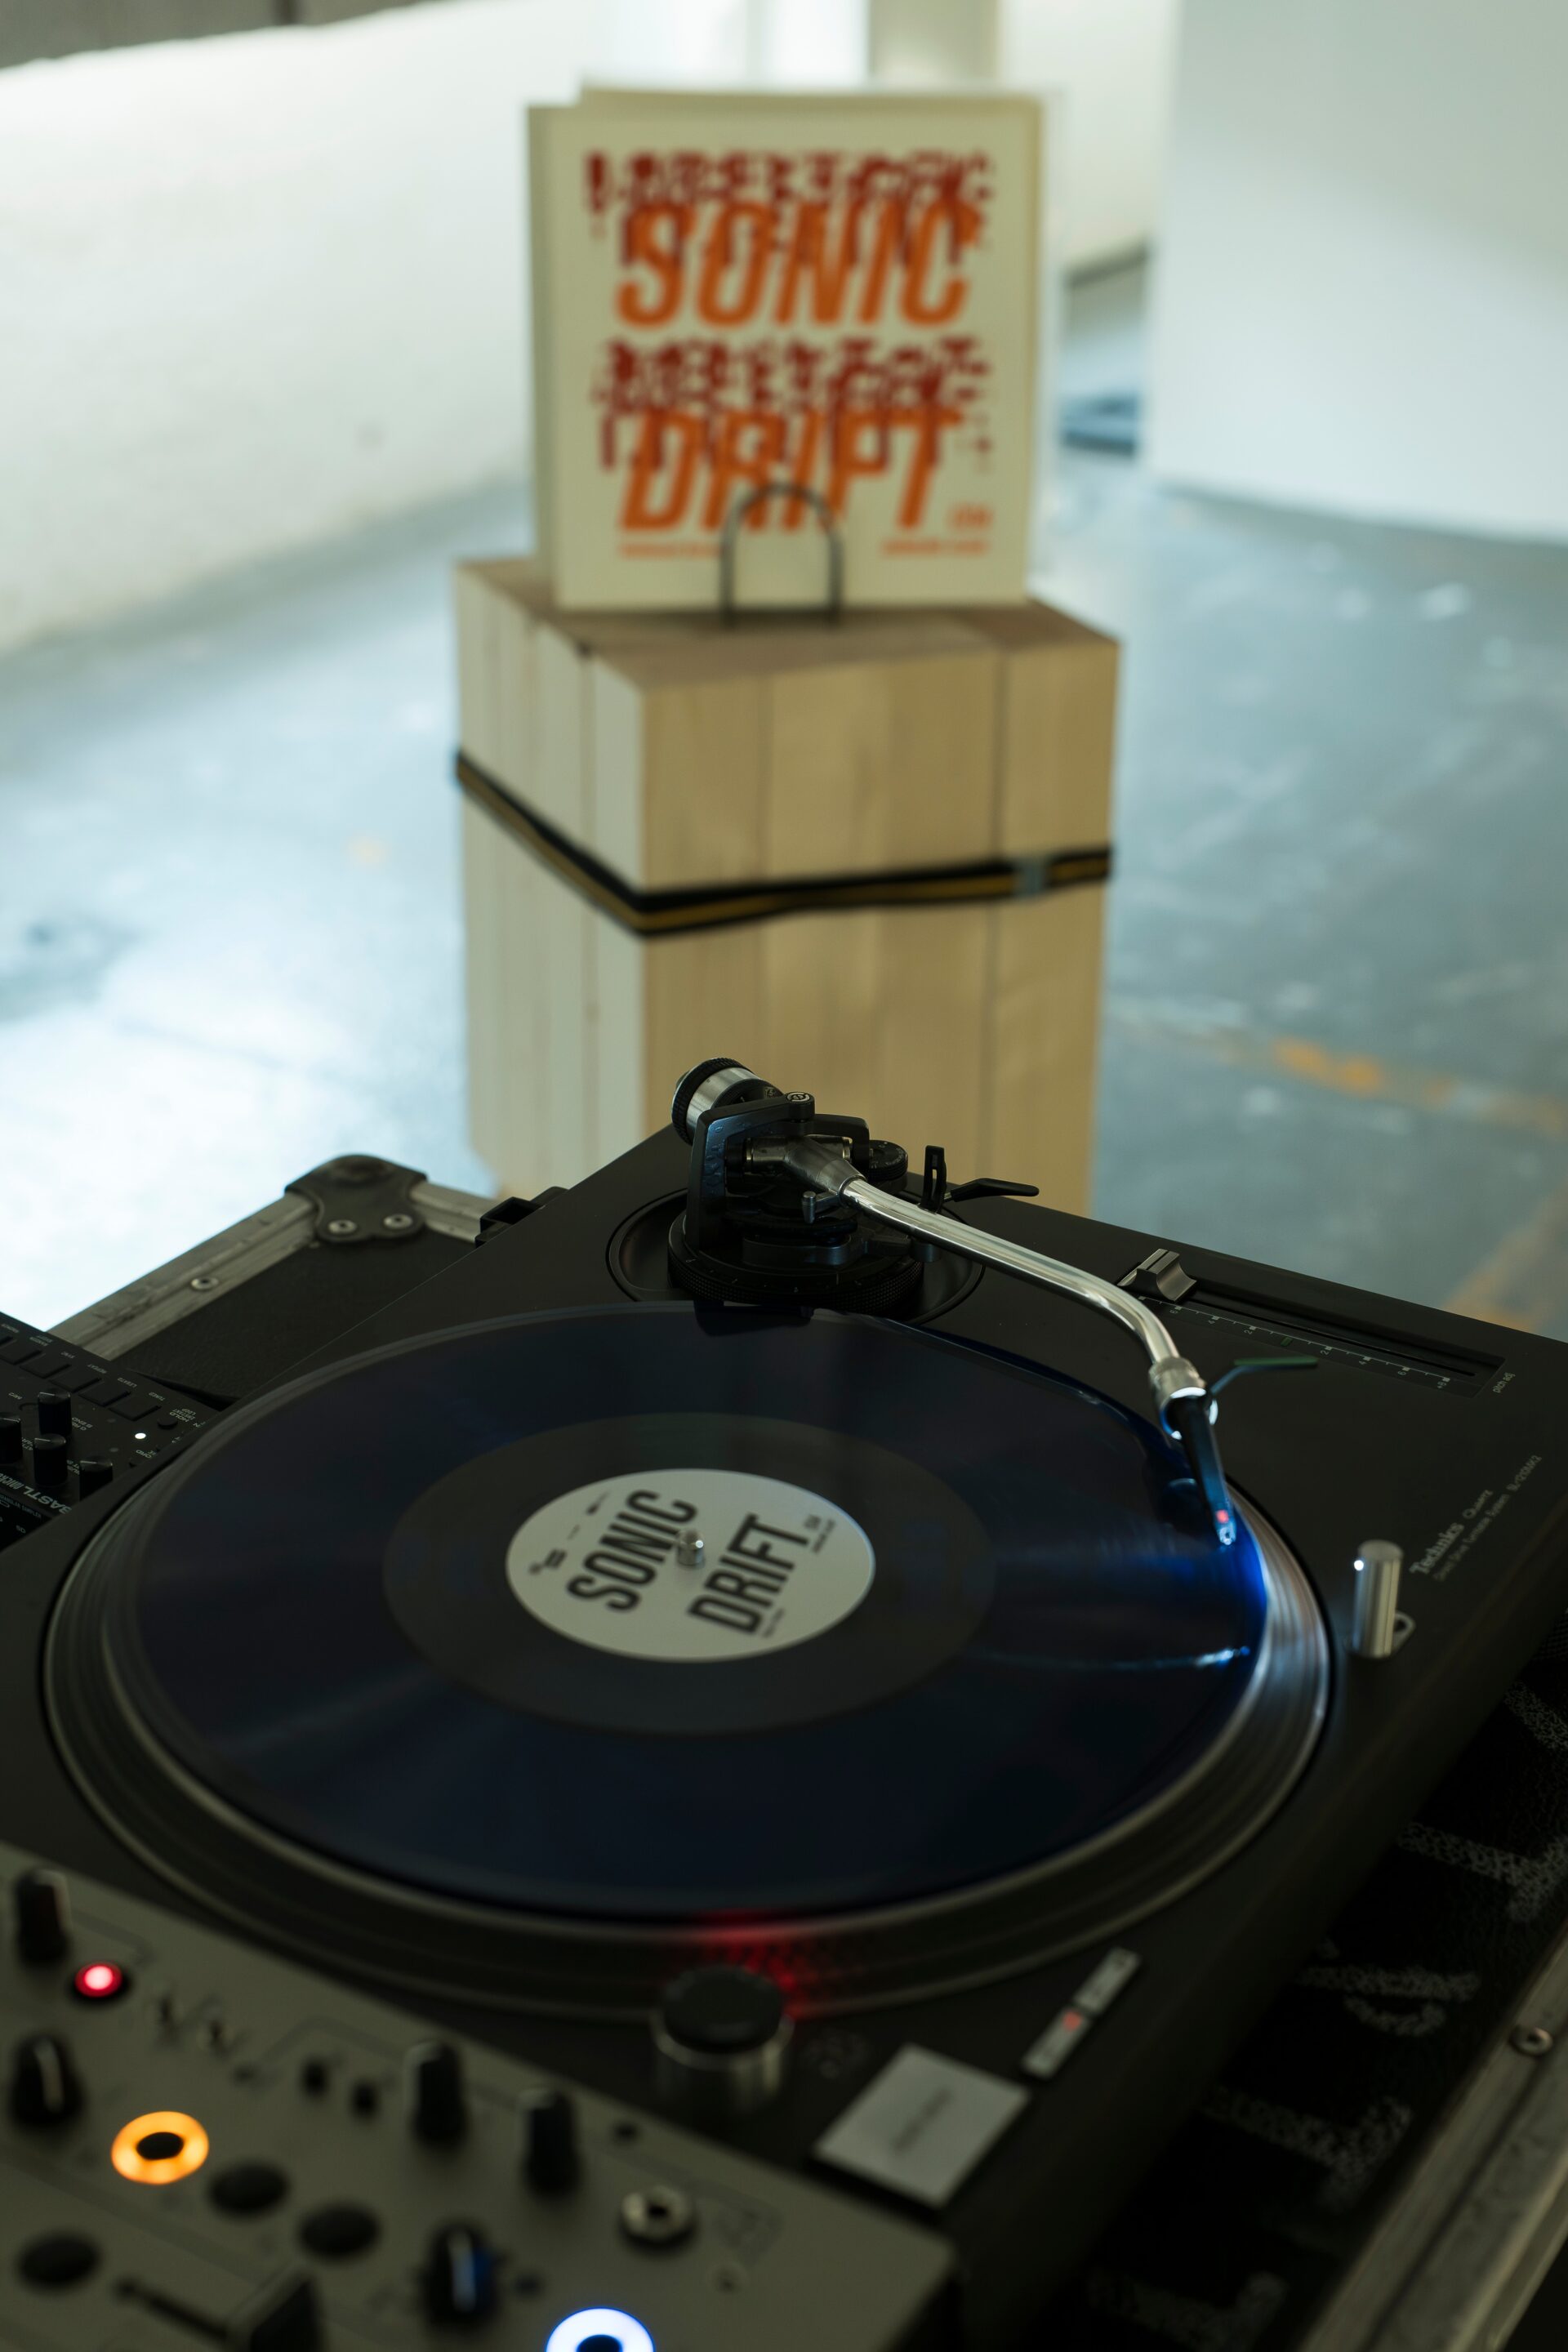
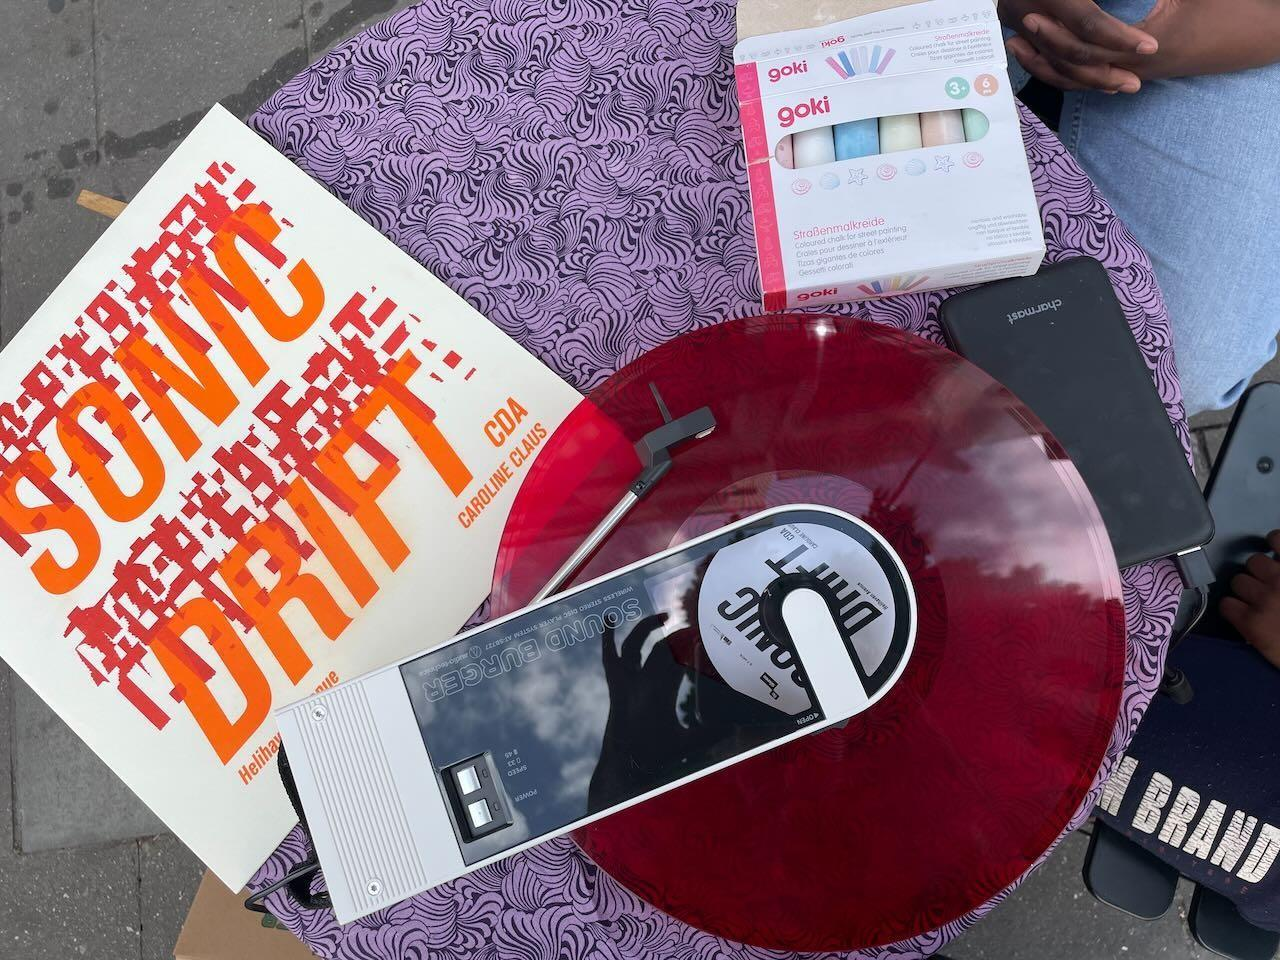
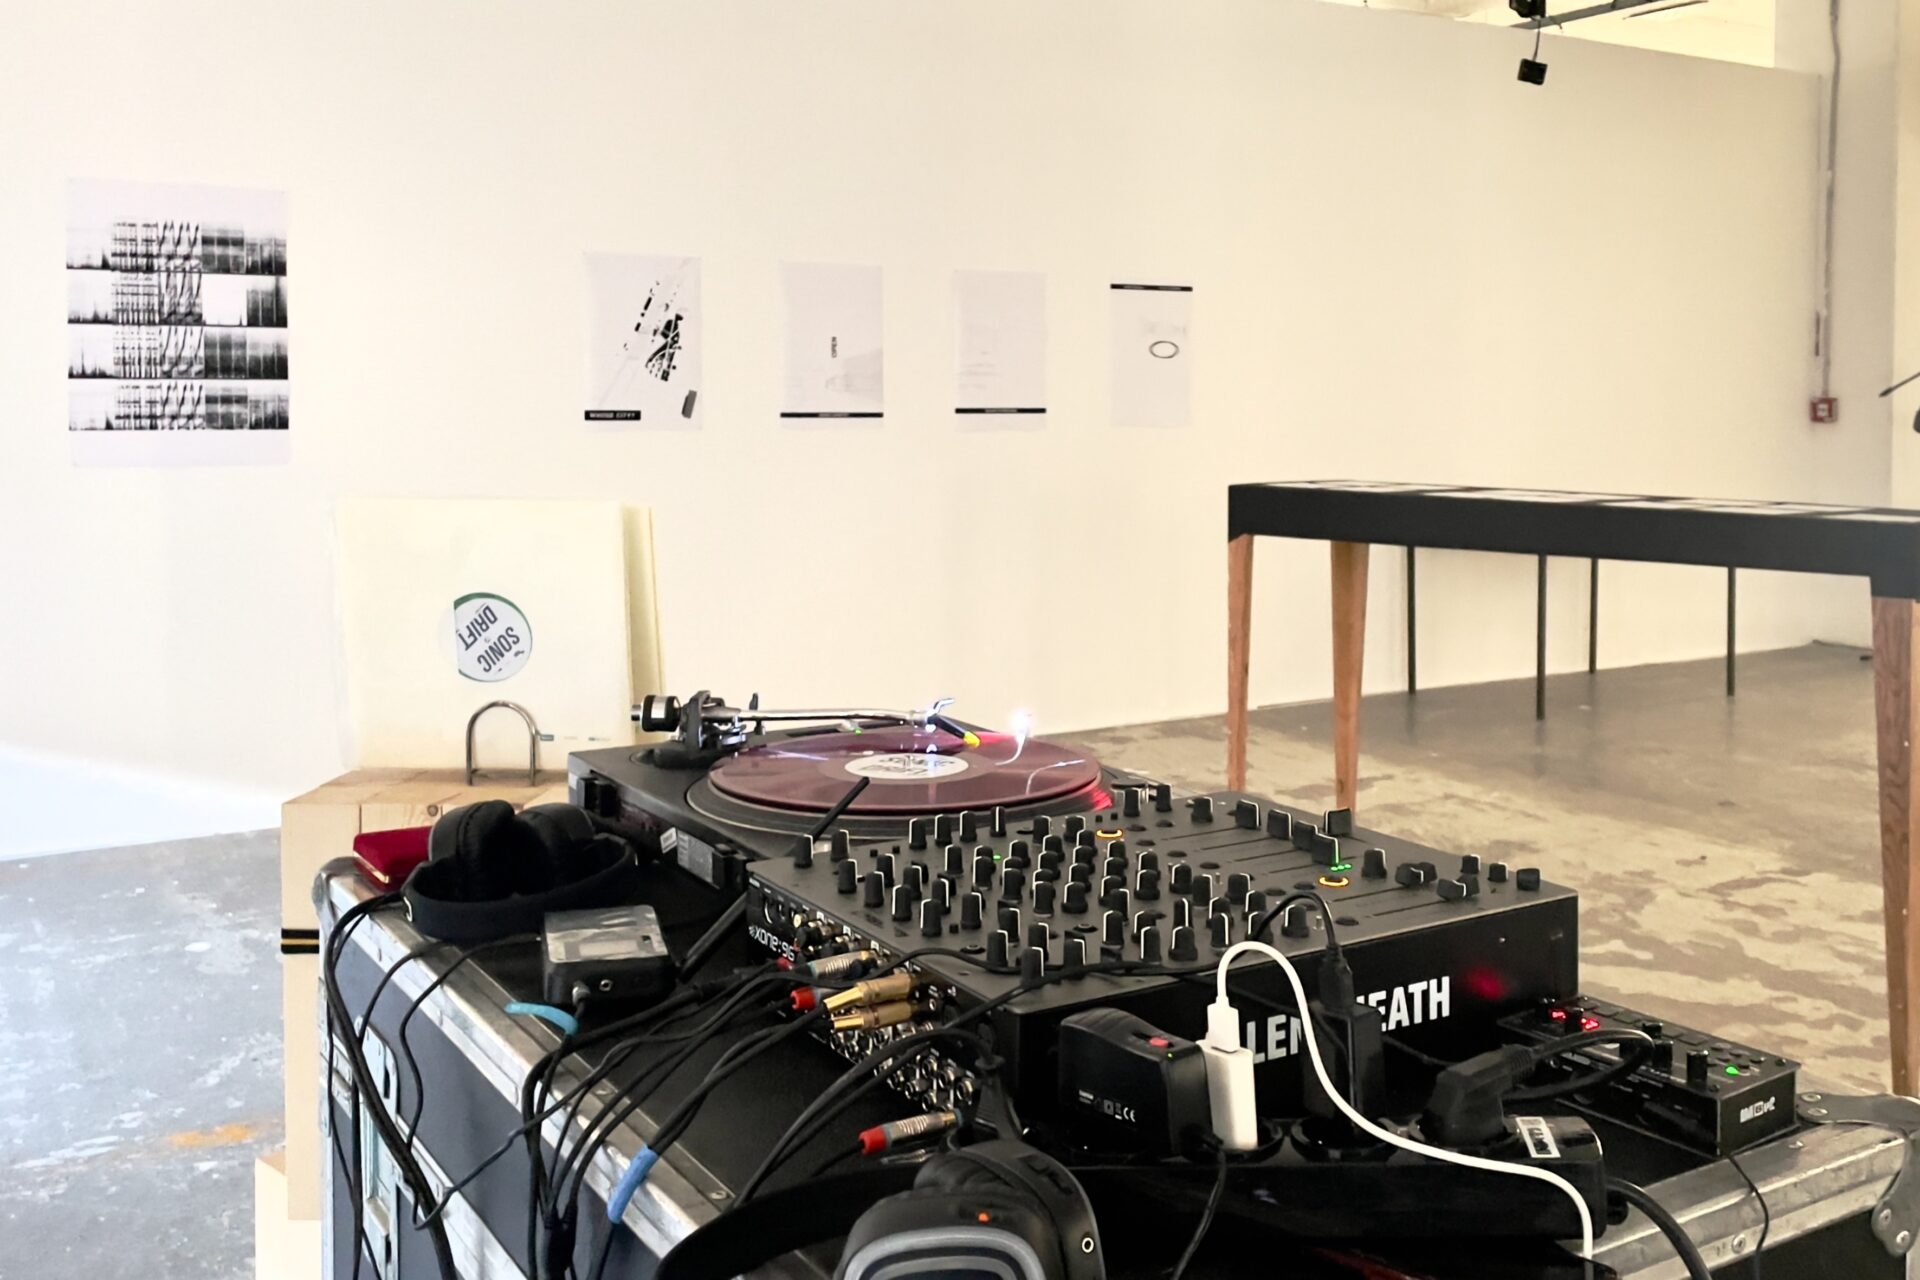
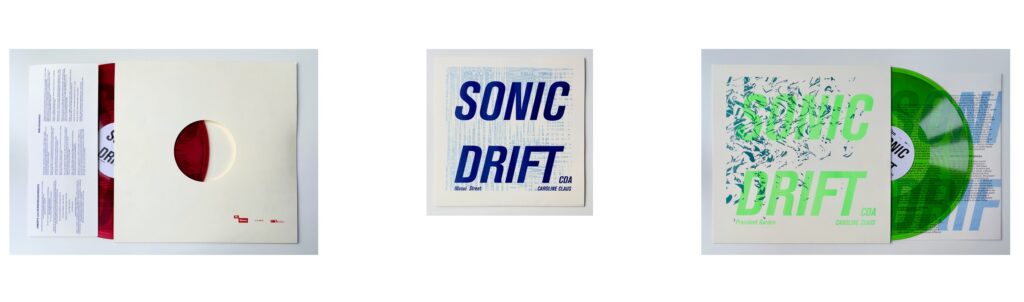
Dubplate Listening Deck: Three hand-cut dubplates (one per pilot site) presented on a modular headphone setup, allowing cueing, looping, and reversal to emphasize temporal and affective textures. (cuts by Dubplate – Lester Michiels)
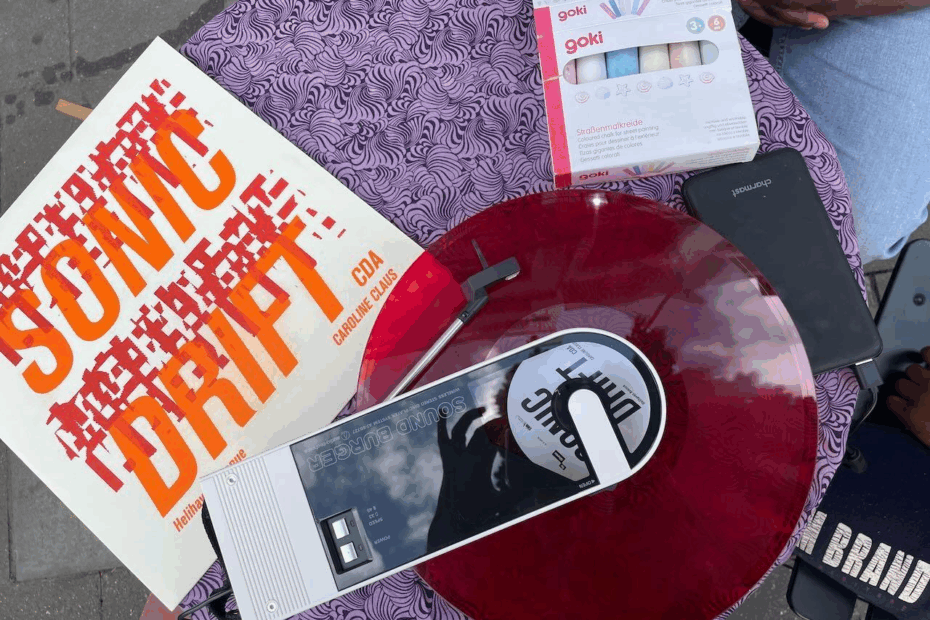
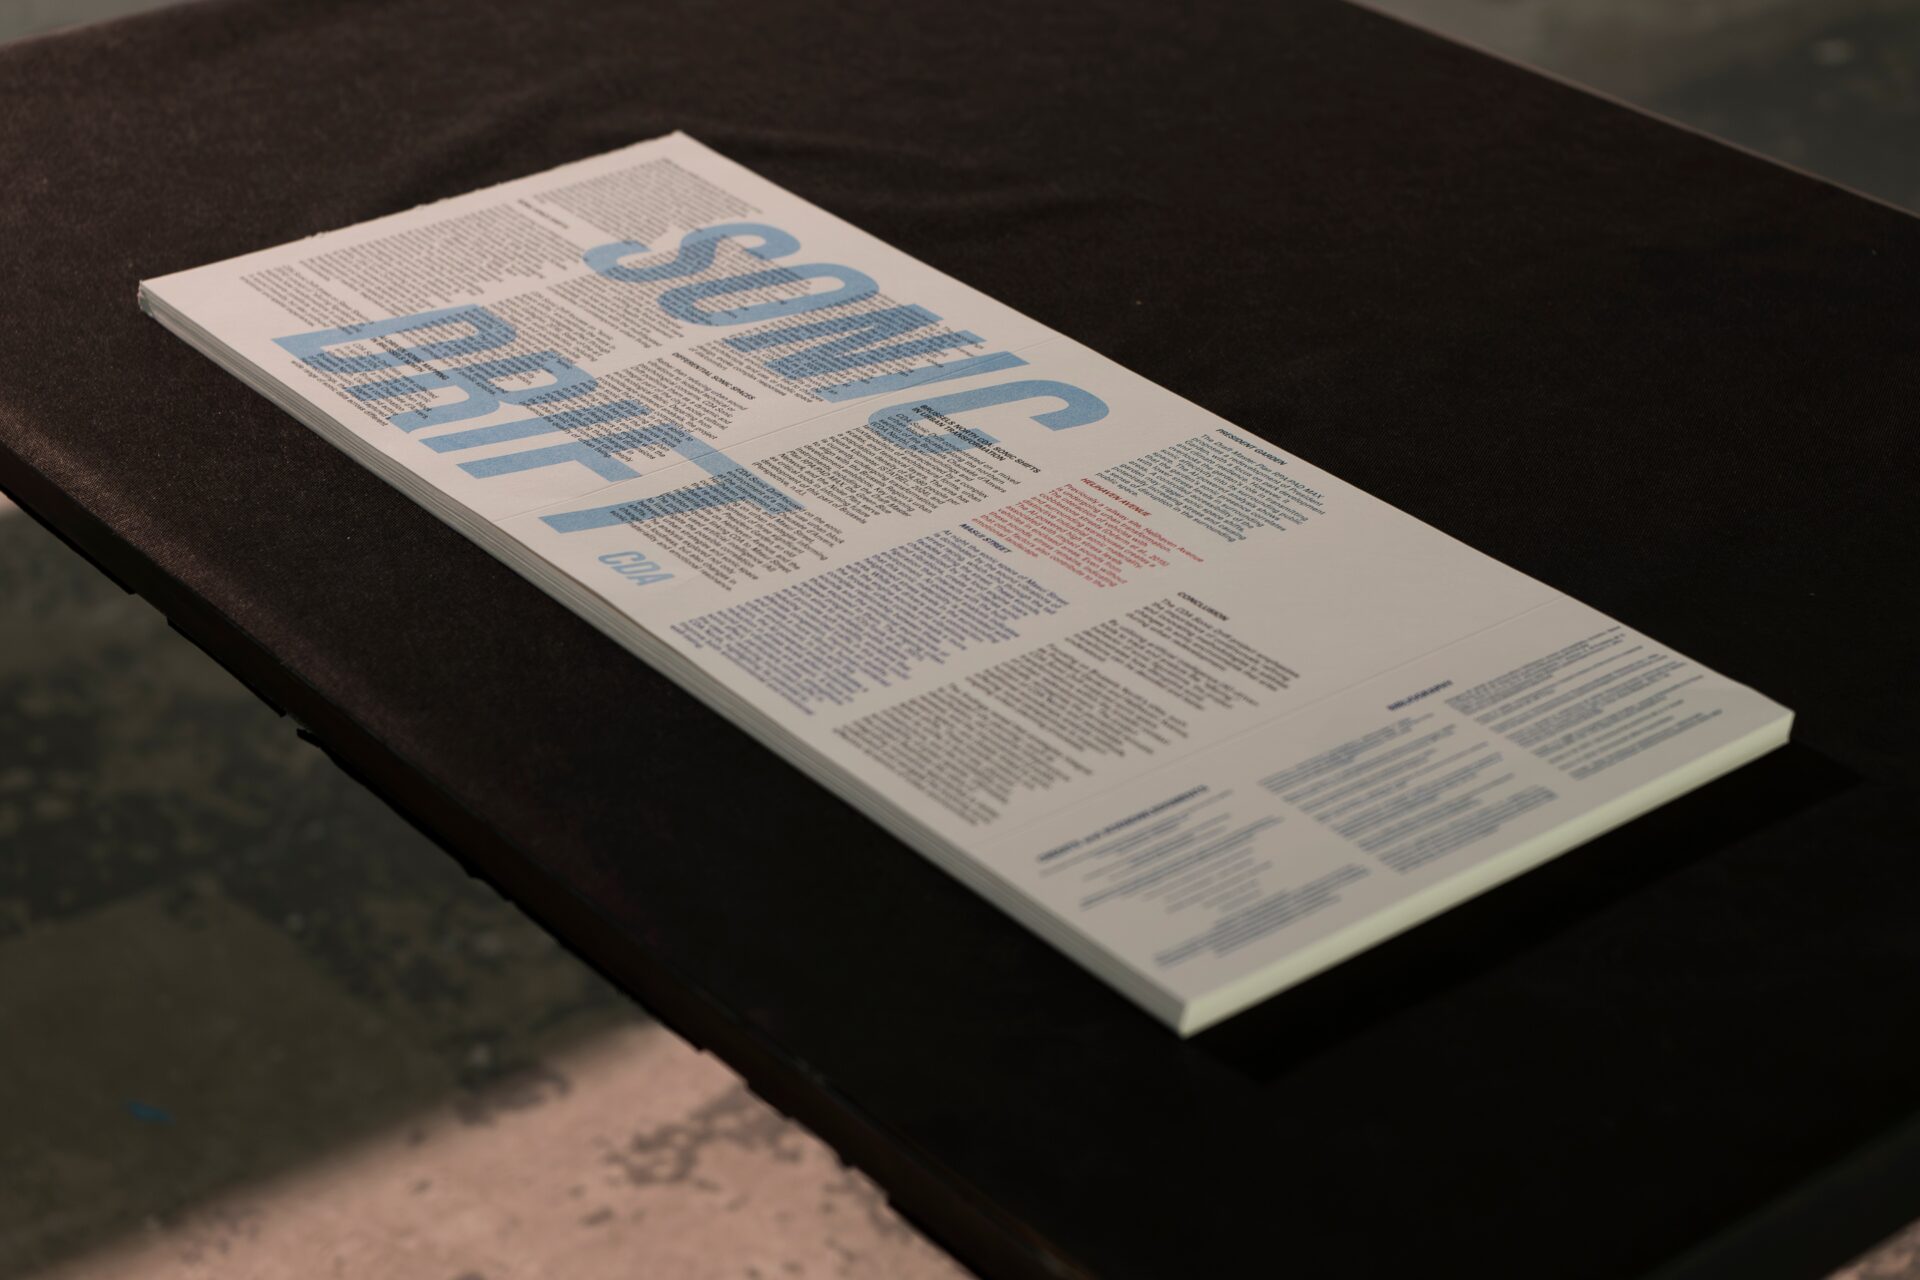
Printed Components: Riso-printed Spatiotemporal Score and GIS-derived comfort maps designed as interactive surfaces for public annotation. (Sleeve design and print by Chez Rosi – Axel Claeys).
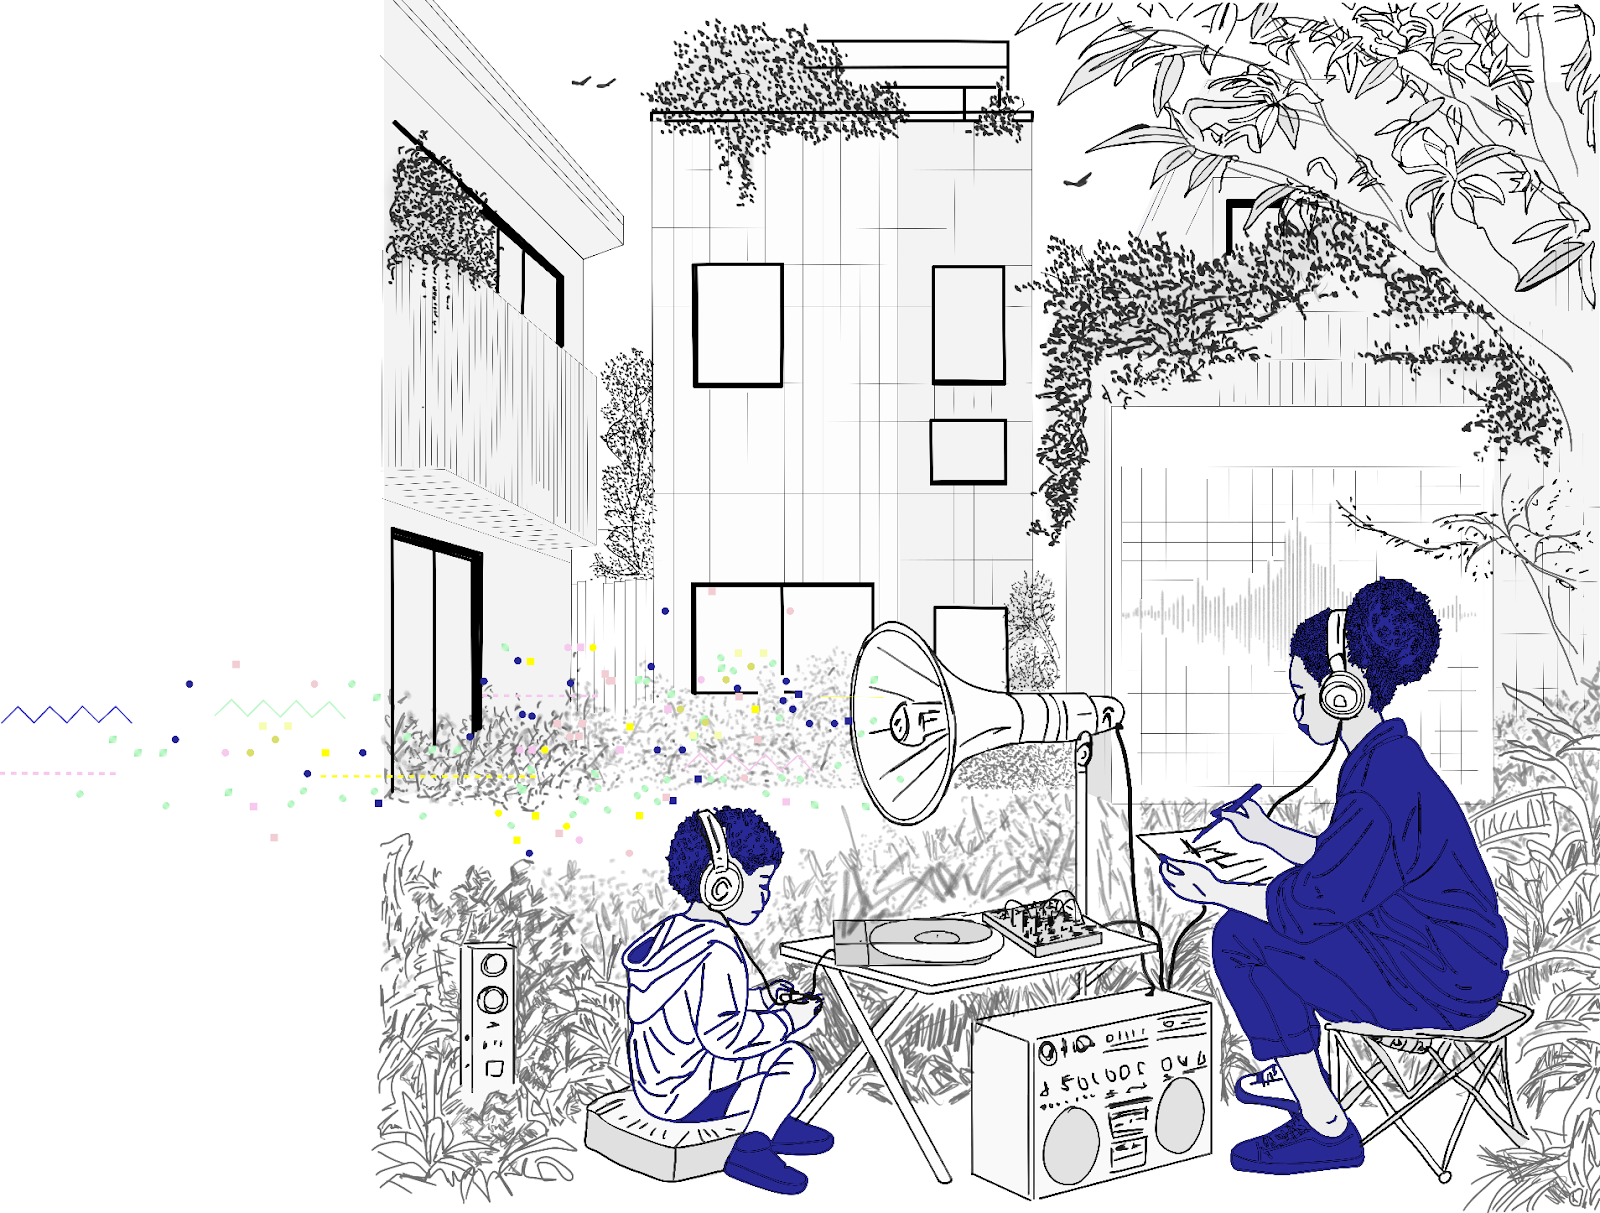
Feedback & Reflection Tools: On-site listening journals and online listening cards collect participant reflections on acoustic comfort, urban density, and affective perception of space, linking sonic aesthetic experience to planning and design dialogue (Artist).
Presentation of the Audio Essay as installation at the final ReSilence Exhibition, BASE – MILANO (IT)
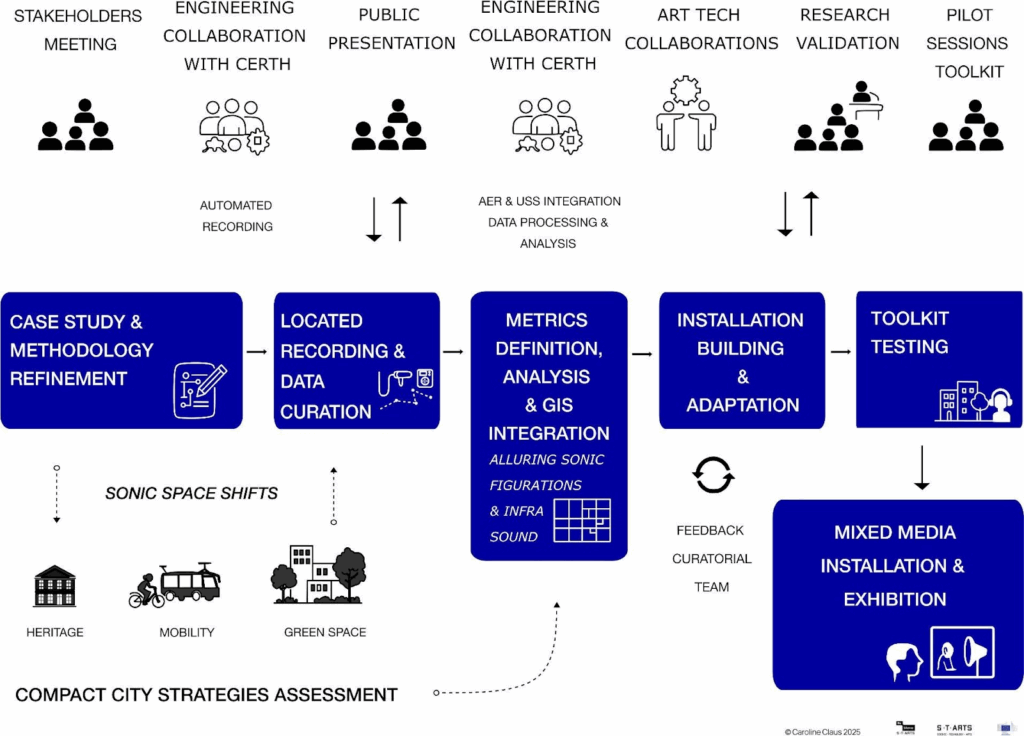
Process Diagram
Methodology Refinement, Prototype, & Installation Building
© 2025 Caroline Claus + logos
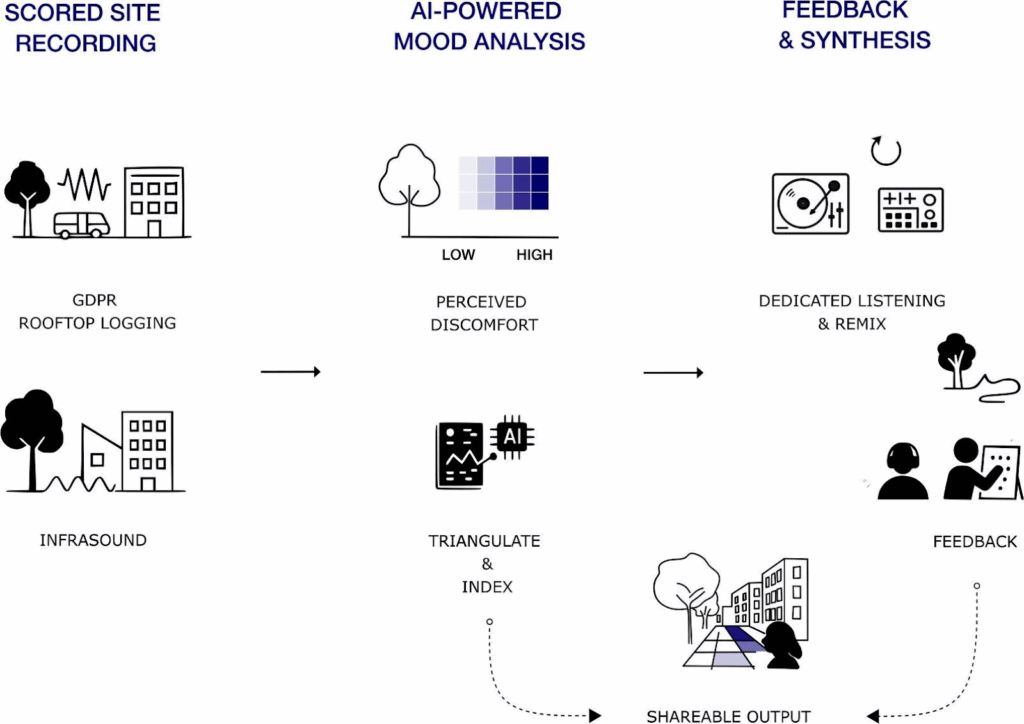
Project Cycle
Site → AI → Re-synthesis diagram
© 2025 Caroline Claus + logos
Eco-Acoustic Environment Analysis (IP: CERTH) provides the computational analysis module and interface outputs (stems, domain summary, valence–arousal trace). The ‘Method & Score’ section presents a curatorial framing of selected analytical outputs by Caroline Claus.
Functional flow
The eco-acoustic analysis workflow consists of three interconnected modules executed in the following order:
1. Source Separation:
The system invokes the universal sound separation module with predefined configuration and model checkpoints. The uploaded audio is decomposed into up to independent stems, representing distinct sound contributors such as human speech, engine/mechanical noise, natural environmental sounds, and background components. These stems are displayed in a structured list with download buttons for independent inspection.
2. Domain Presence Estimation:
Each separated stem is mapped to one of four eco-acoustic categories: Biophony, Geophony, Anthropophony, and Technophony. Classification is performed using filename-inference heuristics and consistent label-mapping rules. The interface displays a donut chart summarizing the proportion of each eco-acoustic domain.
3. Comfort / Affective Analysis:
The comfort estimation module computes a continuous valence–arousal curve using an AST -based perceptual inference model. The output includes a Mel-spectrogram of the input audio and a comfort curve, allowing interpretation of acoustic stressors and perceptual impact.
Pilot #1 — Score-guided Recording (Mar – April 2024): validated sonic geographic score; dataset feeds AI.


Open Sound Lab (May 2024): presentation methodological framework, GDPR automated recording approach, first outcome and data visualisation; feedback sharpened GDPR note, headphone/dubplate format, need for GIS based visualization and feedback towards critical spatial practice.

Ambiances 2024 Paper Presentation (Oct 2024): Score + comfort grid praised for scenario testing.

Pilot #2 — Sidewalk Installation (Jun 2025): mapping/drawing sonic experiences confirmed sequence dedicated followed by embodied listening value. Importance of an easy-to-use feedback format. Dubplate: intergenerational conversation on audio formats.
Pilot #3 — Health-Centre Installation (Jun 2025): light setup enabled flexible integration and engagement; linked greenspace to acoustic comfort and health questions. Importance of an easy-to-use feedback format.
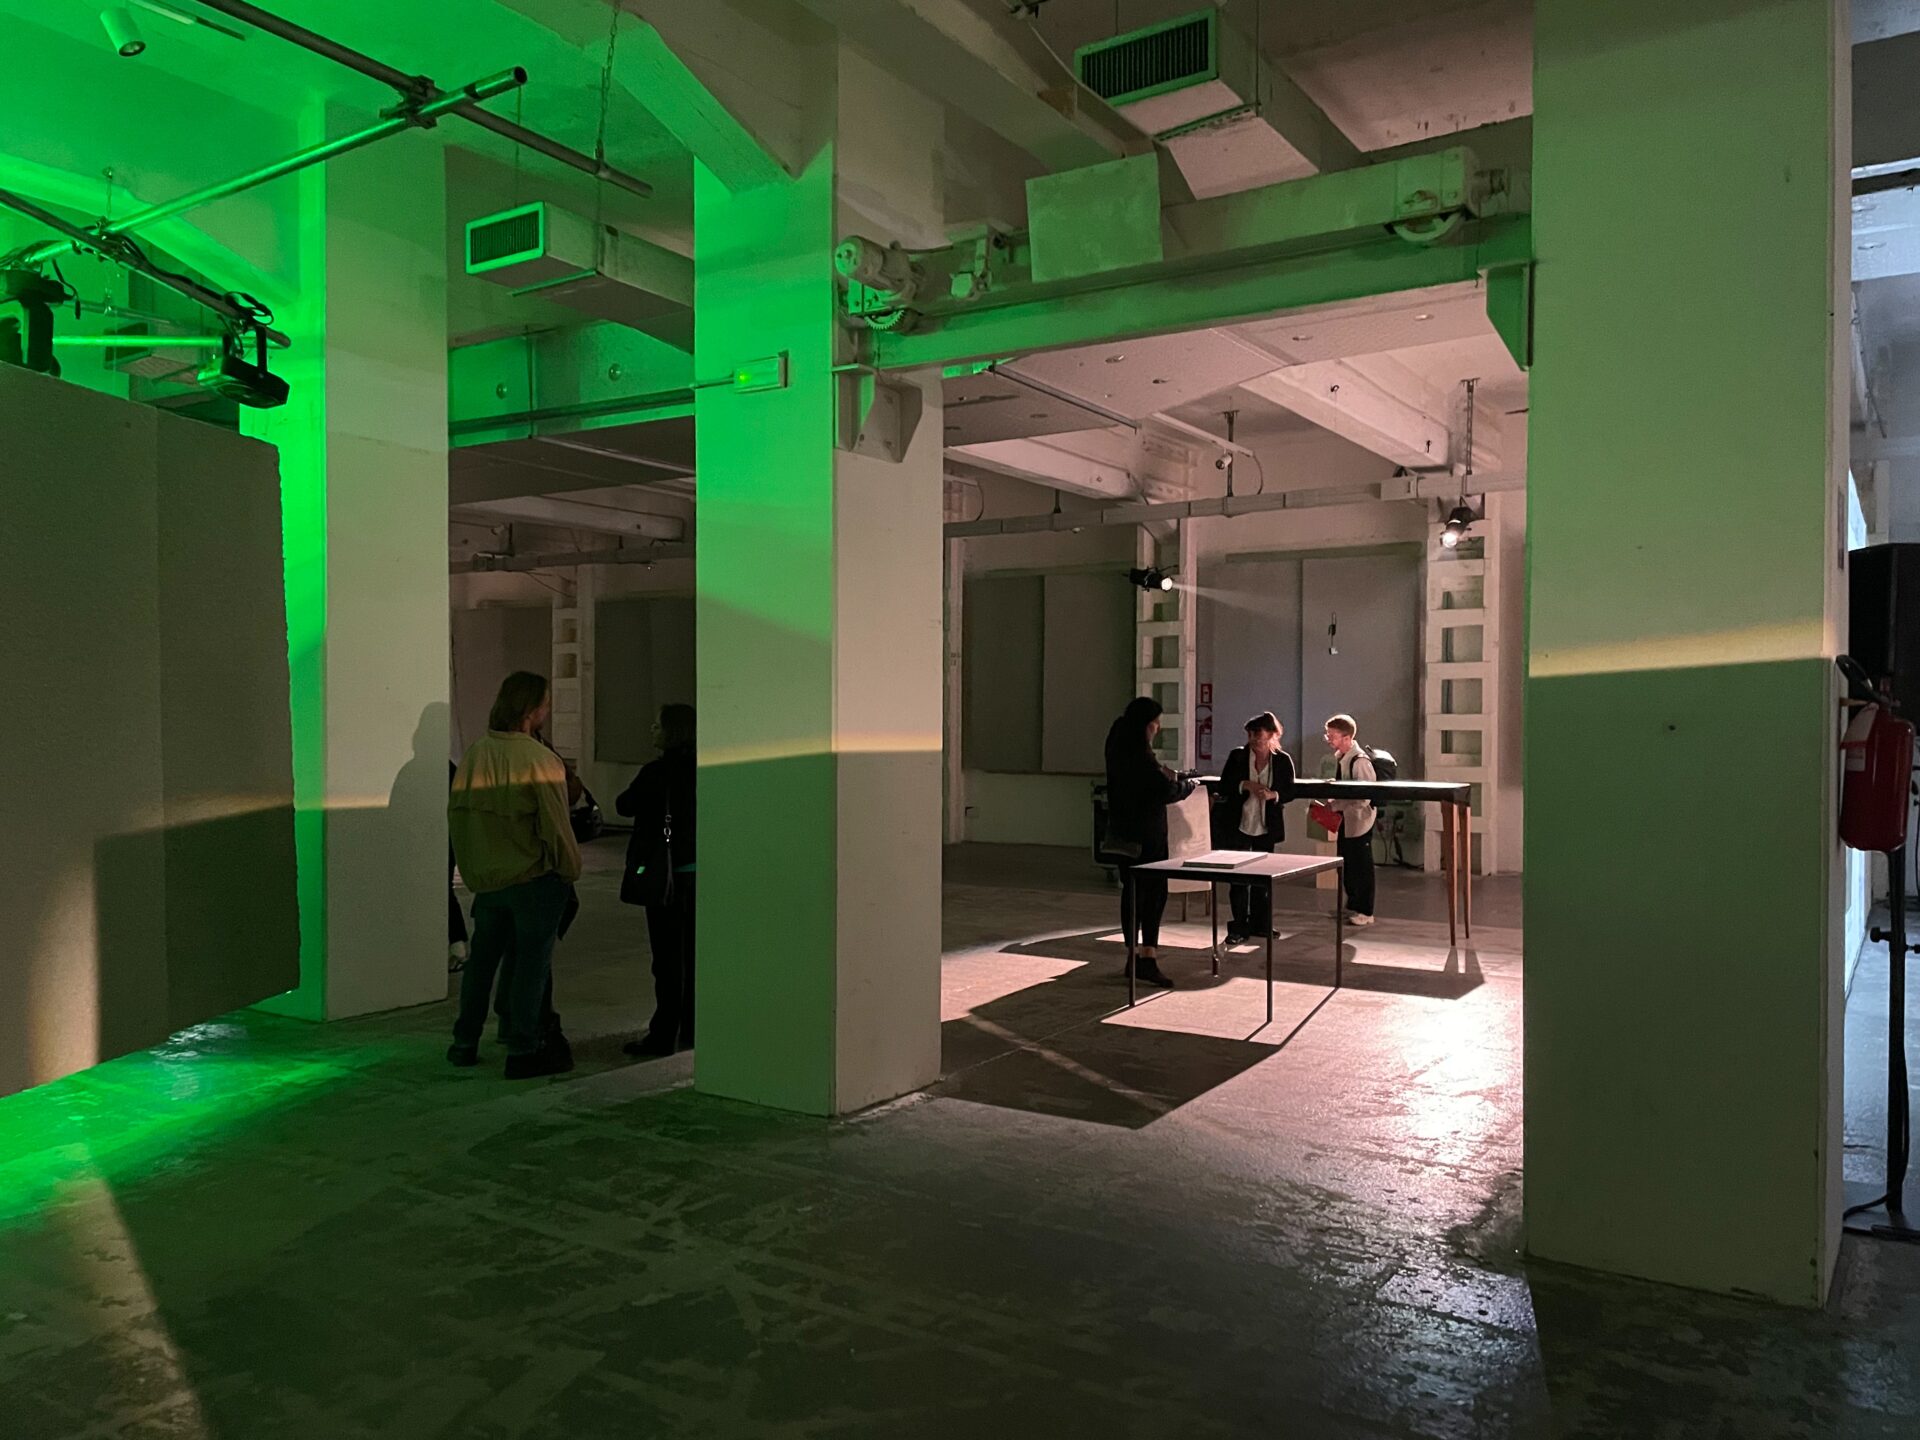
ReSilence exhibition at BASE, Milano
Sonic Geographic Dérive
Part I (President Garden)
Dedicated Listening Station
CDA Sonic Drift – Dubplate Set

Dedicated Listening Station
Audience interacting with mixed media installation
Dedicated Listening Station
On site generation of a feedback sound card
Audience interacting with mixed media installation
Lessons learned:
The process demonstrated the potential of sonic and spatial analysis as instruments for urban strategic assessment, linking sensory and affective dimensions to planning and design strategies. Fieldwork confirmed that affective data, derived from situated listening—both active and passive within urban space—and AI-assisted analysis, can enrich conventional spatial indicators by revealing experiential aspects of urban transformation. Collaboration between the artist/research, CERTH, and community partners—including ReSonance Open Sound Lab (a network of researchers/educators, students and artists and software / electronic musical instruments developers) and local health practitioners—proved essential to align data-driven methods with ethical, contextual, and social sensitivity, reinforcing the value of Art-Driven Experimentation within interdisciplinary research.
Artistic / social / research contribution
CDA extends an art-driven research trajectory exploring how differential listening can inform and rethink the planning and design of urban sites and landscapes. The project introduces Sonic Space Shifts as livability markers, integrating situated listening practices—both active and passive—with AI-assisted analysis to trace affective dynamics within transforming environments. Insights from this process are translated into planner-ready GIS layers and a street-level listening and feedback format, creating opportunities for public reflection and participatory dialogue. The work connects artistic research, AI development, and urban planning policy, contributing to a broader understanding of acoustic well-being and inclusive urban planning and design.
Adaptability / interoperability:
Field Score, audio tracks, SVG maps, and the mapping + feedback workflow are released under a Creative Commons BY-NC-SA license. The GDPR recording software and AI pipeline stays with CERTH; future releases may provide open-source substitutes or a compiled plug-in for full replication.
Impact
Paper and talk at Ambiances 2024 validated the sonic geographic score as a planning and design-research tool; pilots with inhabitants and a health-centre showed the toolkit can turn raw sound, sonic ethnographic observation and subjective experience into planner-ready GIS layers and a flexible street-level installation for dedicated listening and feedback. Pilots with residents and a health-centre showed the toolkit turns raw sound data pressed on dubplate and AI based GIS sonic assessment maps into a flexible street-level installation for dedicated listening and feedback.
Eco-Acoustic Environment Analysis Module